
Australian Infrastructure Budget Monitor 2025-26
Infrastructure Partnerships Australia’s Australian Infrastructure Budget Monitor 2025-26 (Budget Monitor) measures infrastructure funding commitments by jurisdictions for the current Budget year and forward estimates (FY2025-26 to FY2028-29).
Introduction
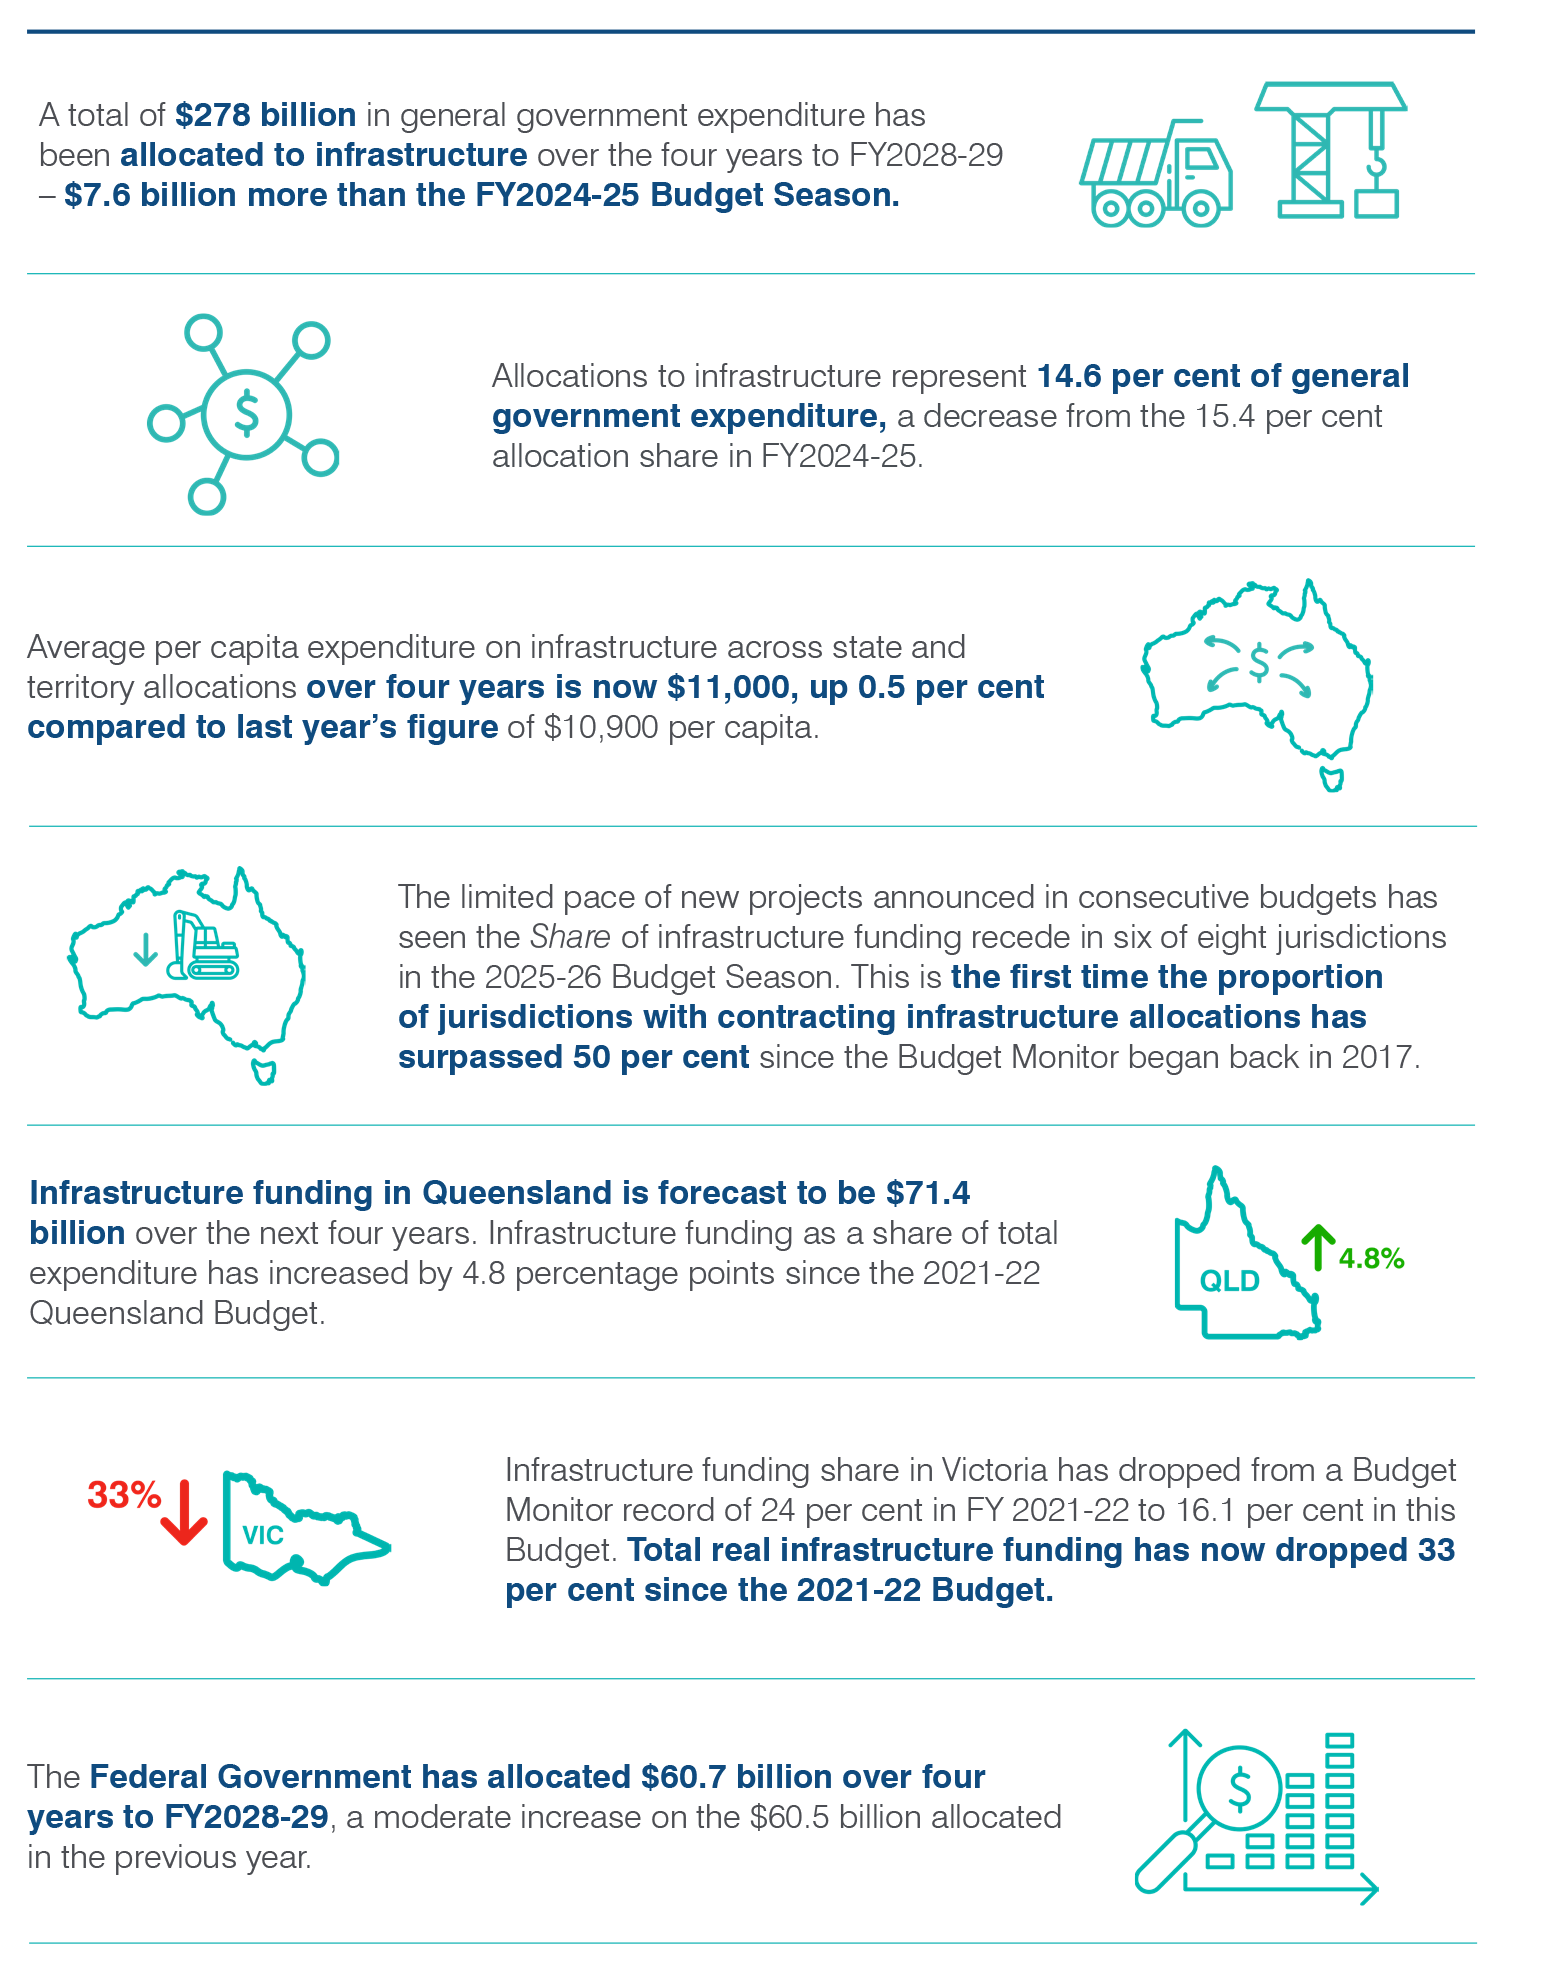
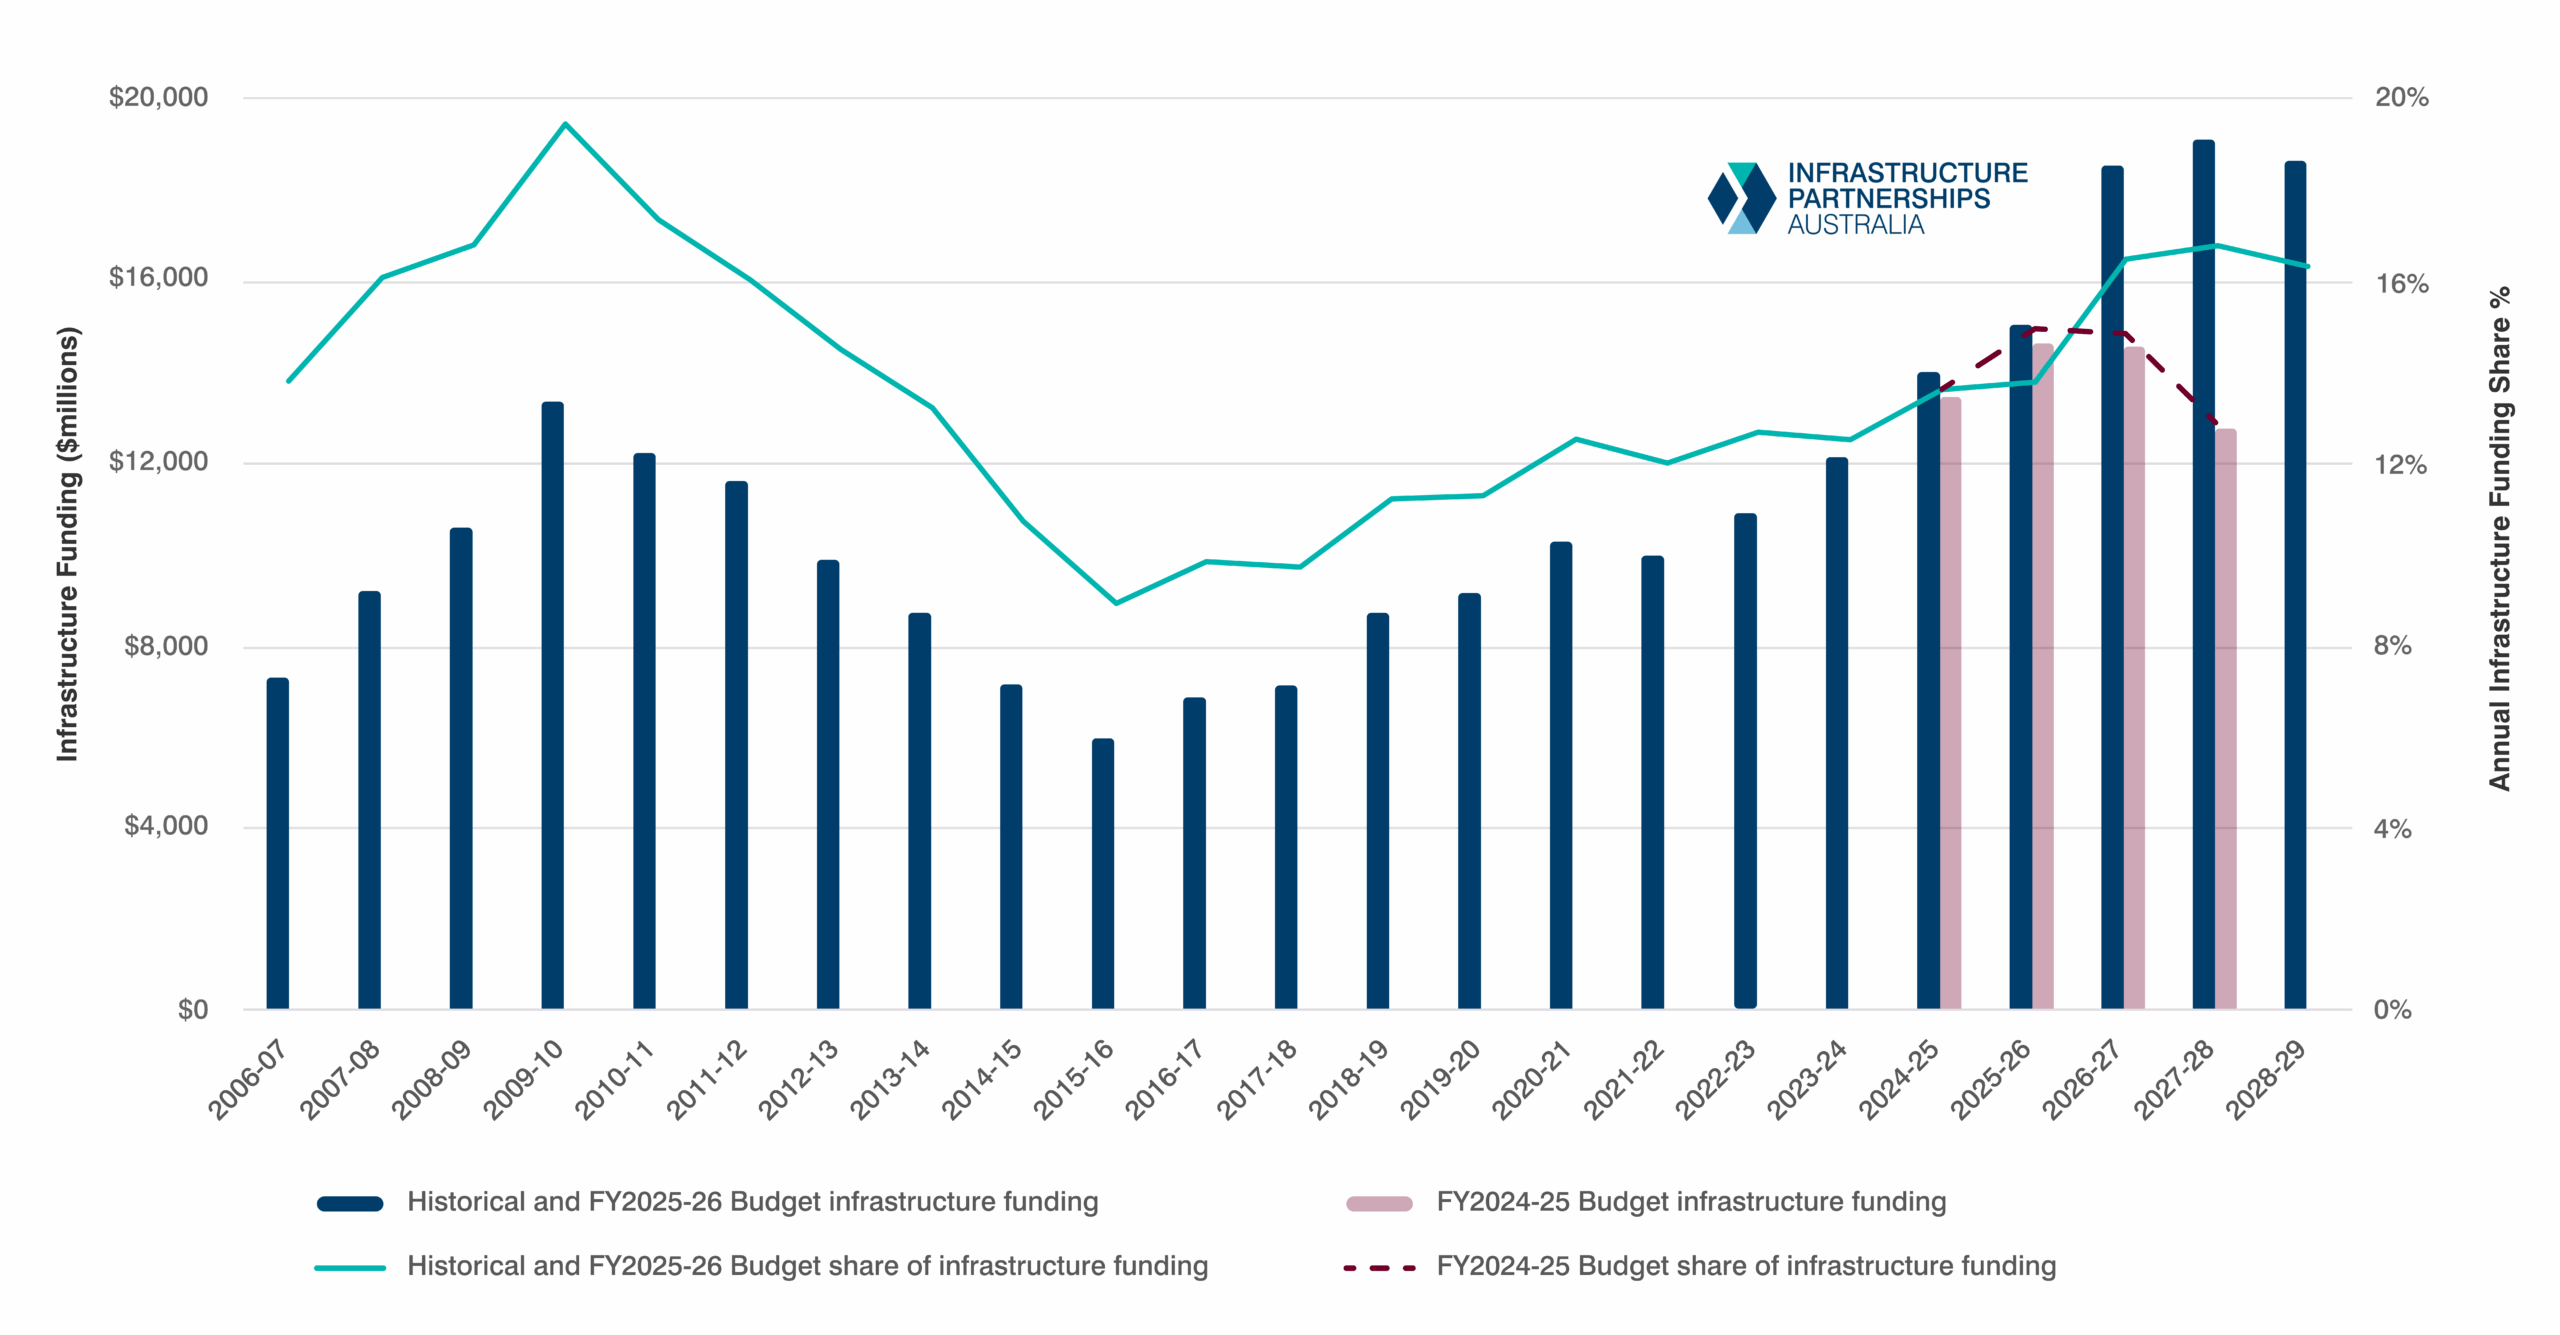
The 2025-26 Budget Season saw Australia’s state and territory governments outline their plans for the next four years. Total infrastructure spending across the country grew moderately, with $278 billion in general government expenditure allocated to infrastructure across all states and territories over the four years to FY2028-29.
This represents a nominal increase of $7.6 billion, and a real increase of $1.9 billion from the FY2024-25 Budget Season. Infrastructure funding as a proportion of total government expenditure declined year on year to 14.6 per cent, down from 15.4 per cent in 2024-2025.
This was one of the most interesting Budget Seasons in recent years, with Australia’s infrastructure market undergoing a cyclical shift. Infrastructure profiles are declining in jurisdictions managing the end of booms – NSW and Victoria – and others – Queensland and South Australia – are entering the early stages of their own expansions, albeit at a materially lower volume than NSW and Victoria.
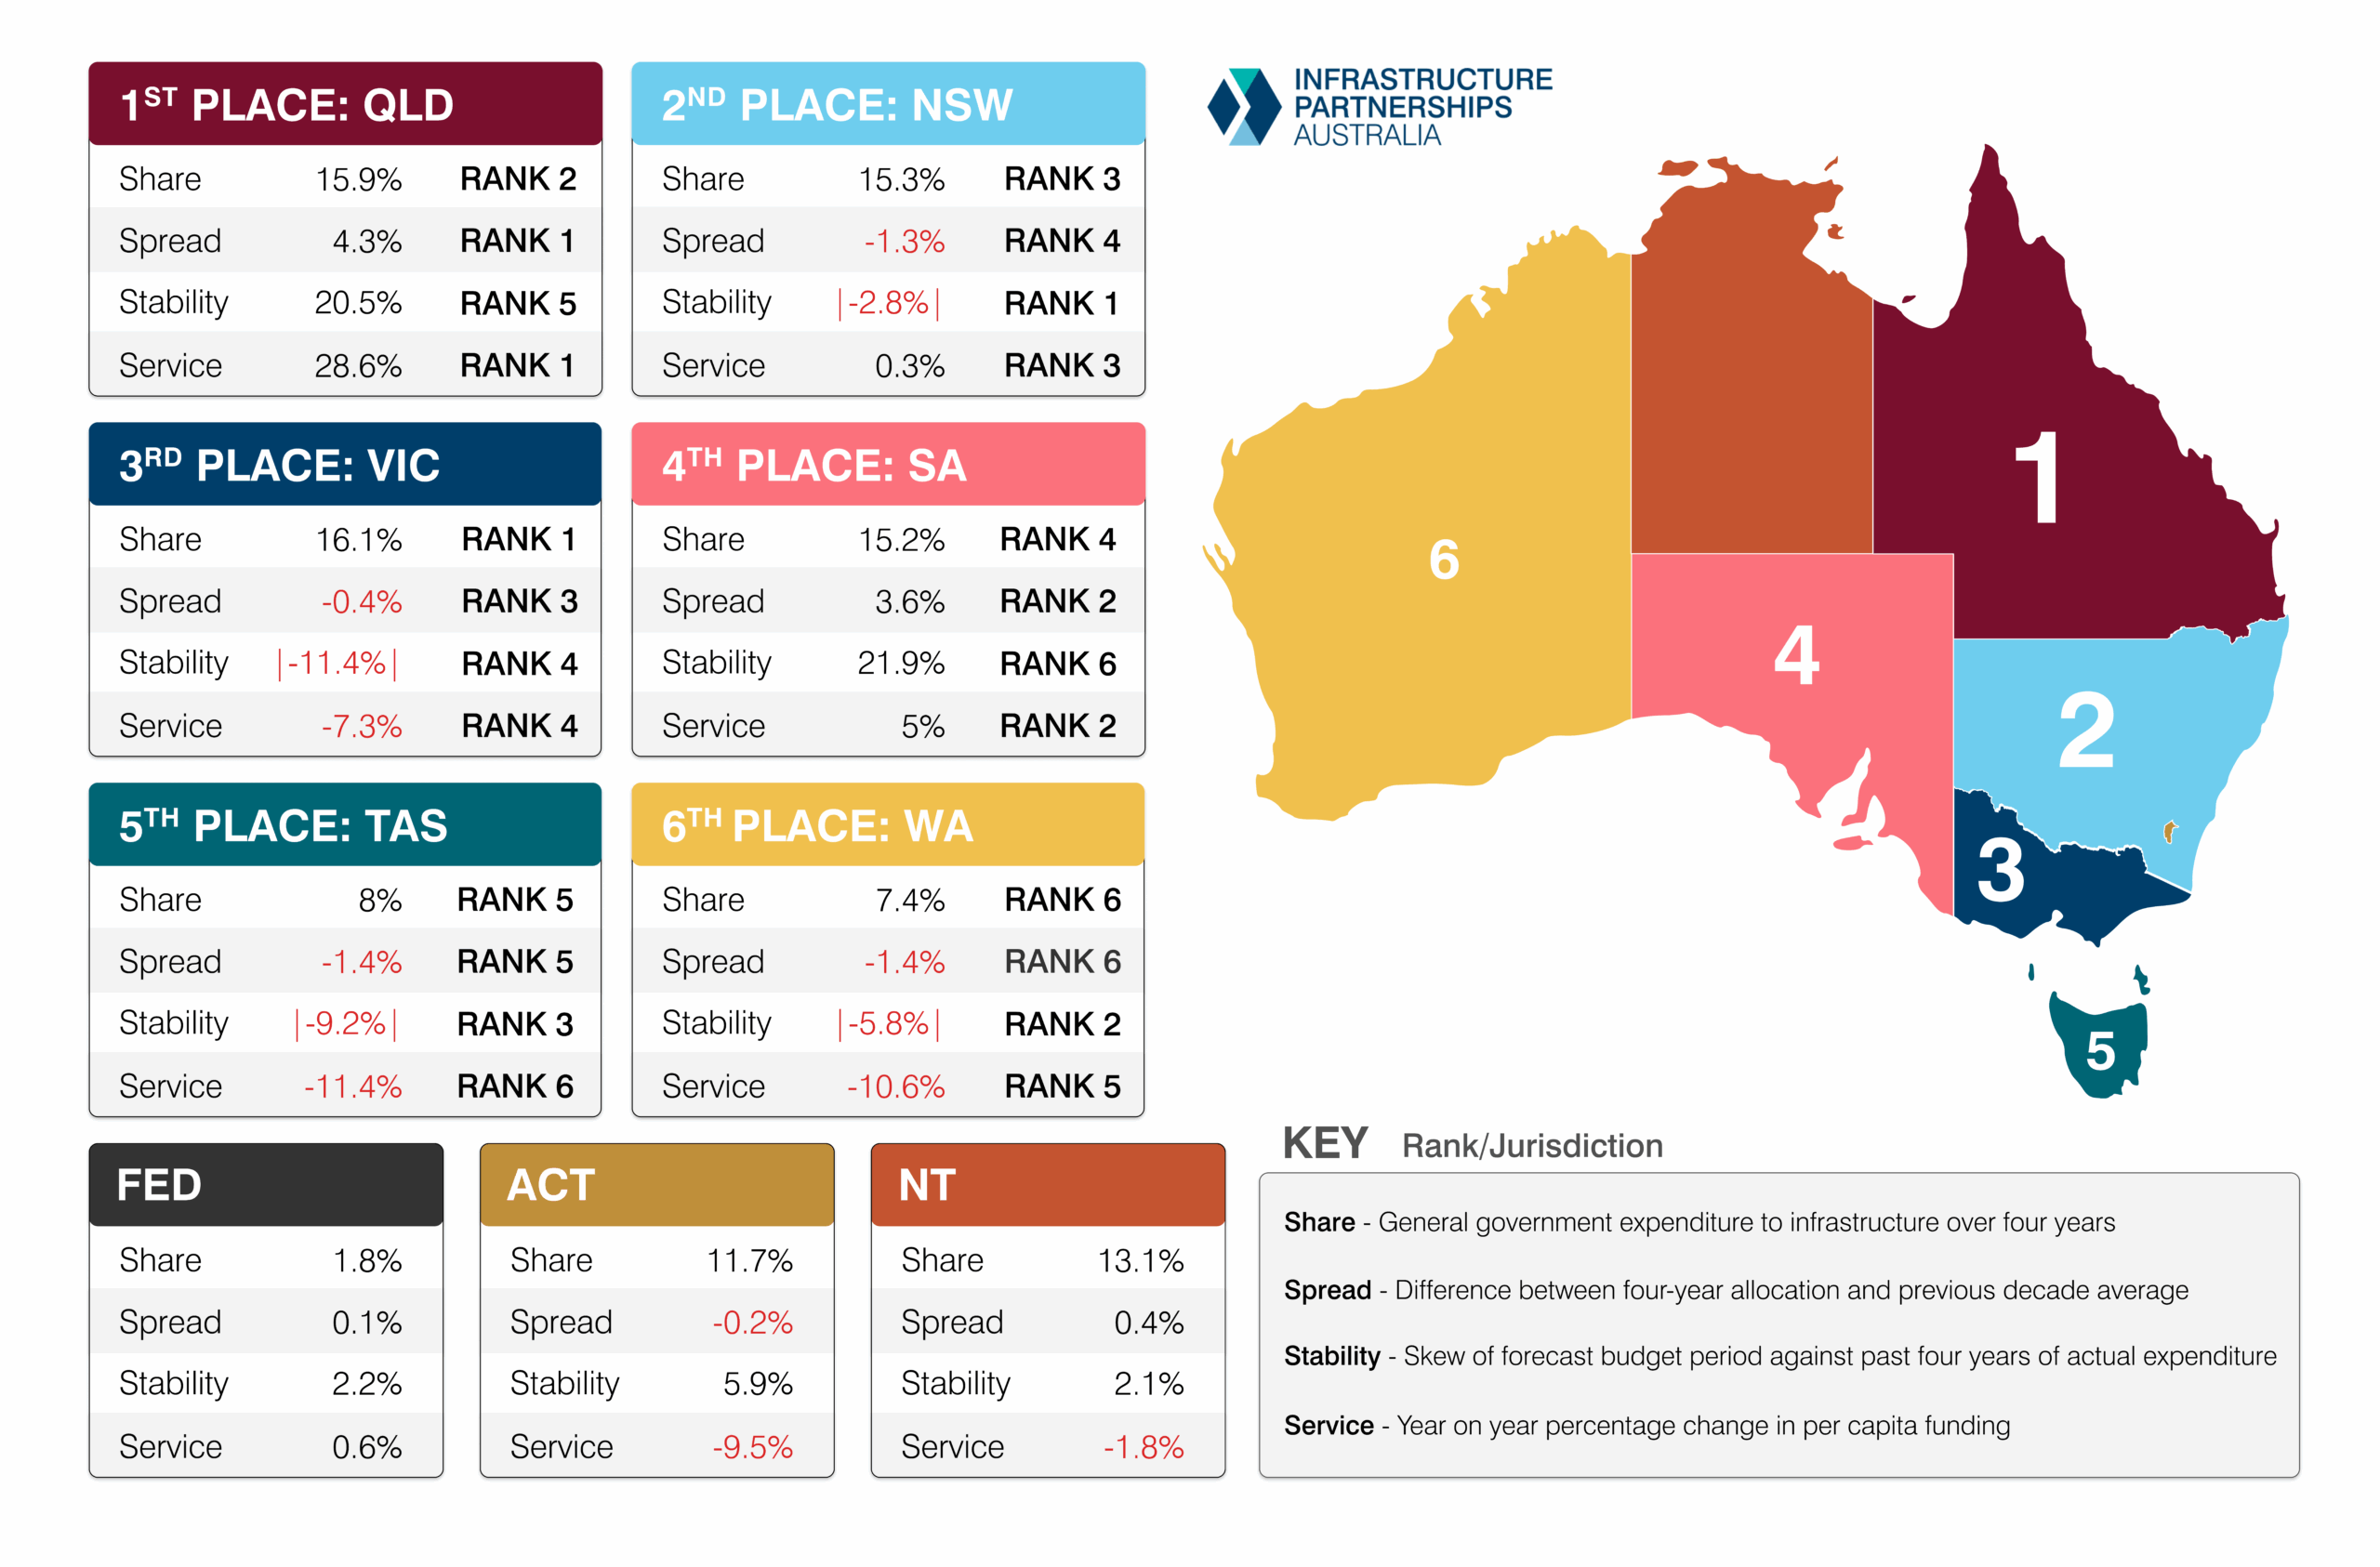
The cyclical positions of jurisdictions this year has spurred the launch of a new methodology for Budget Monitor rankings which goes beyond the singular measure of a jurisdiction’s four-year allocation to infrastructure as a proportion of general government expenditure. Instead, the Budget Monitor now accounts for four measures, compiled into a composite ranking to provide a more holistic view of the infrastructure agenda of Australia’s states and territories.
This new system uses a jurisdiction’s four-year allocation to infrastructure and historical allocations to assess whether infrastructure agendas are expanding or contracting, if this movement is happening in a controlled way, and if governments are managing supply in response to the key infrastructure demand metric – population change. The historic measure – the share of expenditure allocated to infrastructure – remains as a key component of the new methodology.
When distilled into a composite ranking, this new system rewards jurisdictions whose infrastructure allocations expand and contract steadily but maintain a long-term upward trend that is in line or out in front of population growth. Details on the new metrics are included in full in the Methodology section of the report.
Using just the singular measure of Share of general government expenditure allocated to infrastructure sees Victoria come out on top for the fifth year in a row, with a 16.1 per cent allocation to infrastructure. However, when assessing jurisdictions using the full suite of new metrics Share, Spread, Stability and Service, the contractionary Victoria drops to third and the ascendant Queensland climbs to the top step of the podium.
This approach better reflects the true nature of the Australian infrastructure market. The forward pipeline of publicly funded infrastructure in Queensland dwarfs the forward pipeline of work in Victoria, which is slipping from the dizzying heights of unprecedented expenditures earlier in this decade. This new methodology seeks to look beyond Victoria’s large and otherwise attractive headline numbers, comprised mainly of tail funding for existing projects and analyse the true position of the State’s forward infrastructure profile.
On the other hand, Queensland is dealing with the dual challenge of providing for a growing population and preparing for the fast-approaching 2032 Brisbane Olympic and Paralympic Games. In response, consecutive Queensland Governments have increased infrastructure funding, which has grown from 11.6 per cent of general government expenditure in the 2022-23 Budget to 15.9 per cent in the 2025-26 Budget. With more funding to come as the State gears up for the Olympics, the infrastructure position in Queensland is one of budding optimism.
Of course, governments don’t increase their infrastructure allocations forever. Infrastructure investment is typically cyclical and endures periods of expansion and contraction, with steady approaches to this movement creating more efficient outcomes. To account for this cycle, the new Budget Monitor methodology uses the Stability measurement – how skewed infrastructure spending is to the current budget period or the previous four years of actual expenditure. This metric seeks to reward jurisdictions that avoid ‘Boom-or-Bust’ approaches and instead make allocations that do not move too abruptly – regardless of whether infrastructure spend is going up or down.
The best example of this steady approach in this Budget Season is in NSW, where the Government has made a policy decision – now telegraphed over three budgets – to set a deliberate and steady path to reduce its infrastructure expenditure from 2.7 per cent to 2 per cent of Gross State Product. This approach has given the sector time to make the necessary preparations for a reduction in Australia’s biggest market and enabled efficient reallocations to jurisdictions requiring more resources.
We hope this new methodology provides readers with a greater level of context, detail and interrogation of the Budget Papers that goes beyond the project-level allocations and assesses jurisdictions as distinct markets, subject to different forces. Full project-level coverage of each Budget remains available to our members on the Budget Hub.

About the Budget Monitor
Background
Infrastructure Partnerships Australia’s Australian Infrastructure Budget Monitor 2025-26 (Budget Monitor) measures infrastructure funding commitments by jurisdictions for the current Budget year and forward estimates (FY2025-26 to FY2028-29). This report collates information from the latest Budget papers from Federal, state and territory governments to provide insights into their infrastructure investment programs beyond the headline figures. The purpose of the Budget Monitor is to inform the community, industry and researchers about historical and projected public infrastructure investment in Australia. It allows readers to compare and evaluate the commitments by governments to building infrastructure.
Methodology
Budget Monitor rankings are made using a cumulative ranking approach for each state based on relative performance across four metrics of equal weight. These metrics are derived from forecast and historic general government expenditure allocations to infrastructure and population figures provided by the Australian Bureau of Statistics. The Budget Monitor does not seek to assess the prudence of project-level investments, rather, it is a measure of the quantum and trend of infrastructure spending in public budgets. This approach is taken as the Budget Monitor seeks to assess the importance of infrastructure relative to total expenditure, not the quality of expenditure.
Infrastructure funding figures are primarily drawn from budget-reported allocations of general government expenditure to infrastructure. Where unavailable, purchases of non-financial assets and finance leases (e.g. PPP payments) serve as proxies. This approach ensures consistency across varying budgetary practices and normalises for economic and geographic differences, providing a robust comparison of the strength of each jurisdiction’s infrastructure program.
Total general government sector expenditure – expenses plus net acquisitions of non-financial assets – is used as the baseline for assessing the total proportion of expenditure allocated to infrastructure.
General government expenditure excludes spending by government-owned business enterprises or public corporations, such as utilities or ports, which are required to recoup investment and operational costs through own source revenue such as utility bills. This approach isolates taxpayer-funded decisions and excludes expenditure from user-pays or equity-financed projects, which are not paid for by taxpayers. As a result, figures may diverge from government media releases, but they better capture the fiscal choices directly attributable to public budgets.
Budget figures from the Federal, Australian Capital Territory (ACT) and Northern Territory (NT) Governments are assessed in the Budget Monitor but excluded from rankings. The Federal Government primarily funds state and territory infrastructure projects. As such it is not formally included in the rankings. The Budgets of the ACT and NT are excluded from the rankings due to the functional differences between the governments and economies of territories and states. Territory governments are much smaller than state governments and have fundamentally different rules for collecting revenue and spending capital, which make direct comparisons potentially unfair for territory budgets. We include analysis of all three budgets in the report to provide a comprehensive overview of all funding commitments.
The four metrics used to make the overall Budget Monitor rankings are:
Share – General government expenditure to infrastructure over four years
This metric is the base measure for the Budget Monitor methodology and measures a jurisdiction’s proportion of general government expenditure allocated to infrastructure over the four-year budget period. This metric is designed to measure infrastructure’s importance relative to total expenditure between FY2025–26 and FY2028–29. Measuring expenditure in this way enables comparison of large and small jurisdictions.
Spread – Delta between four-year Share and previous decade Share
This metric measures the delta between the Share of general government expenditure allocated to infrastructure over the next four years, and the Share average of the previous decade. Complementing the Stability metric, the Spread metric is designed to assess whether a jurisdiction’s infrastructure profile is exceeding its long-term trend, looking beyond the infrastructure cycle to reward long-term uplift in expenditure.
Stability – Infrastructure expenditure rate of change
Infrastructure investment is typically cyclical, with large individual interventions not required every year to uphold service provision. Consequently, infrastructure allocations often oscillate up and down. However, infrastructure markets which limit the scale of these oscillations create the foundations to enable long-term productivity and efficiency gains.
To assess the Stability of a jurisdiction’s infrastructure profile, this metric assesses the skew of the current Budget’s infrastructure allocation against the previous four years of actual expenditure. This ‘Inverse Absolute’ measure seeks to account for the cyclical reality of infrastructure investment, with ‘Boom-and-Bust’ approaches finishing at the bottom of the rankings and steady movements up or down rewarded in the rankings.
Service – Percentage change in per capita funding
The supply and demand of infrastructure is ultimately governed by a simple equation of service delivery commitments and population changes. The Service metric acknowledges this equation assessing the percentage change in per capita funding – total infrastructure funding divided by total population – between the previous budget’s four-year allocation and this budget’s allocation. The jurisdiction which increases its per capita infrastructure the most is rewarded with the highest rank.
Each state is ranked on its performance on each metric from first to sixth. These are then combined to calculate an overall rank, with the lowest aggregate rank awarded the top position in the overall Budget Monitor ranks. All four metrics are provided equal weight in this calculation. Where two jurisdictions are tied in the overall rank, their respective performance in the Share metric is used as a tiebreaker.
Together as a composite rank, these metrics reward jurisdictions which make infrastructure allocations that emphasise fiscal sustainability and improve service delivery in the short and long term. Jurisdictions who make large abrupt movements in their infrastructure allocations and who do not seek to improve service delivery are penalised.
Figure 1: 2025-26 Australian Infrastructure Budget Monitor Rankings
Source: Infrastructure Partnerships Australia analysis of 2025-26 Budgets

Key Insights

1st Place: Queensland
Source: Infrastructure Partnerships Australia analysis of the 2025-26 Queensland Budget
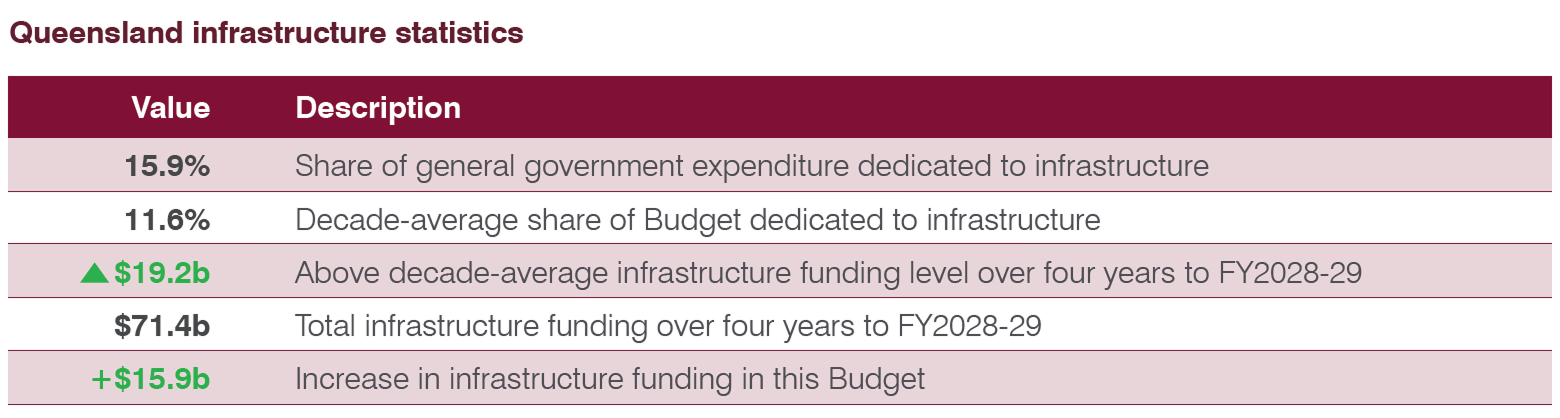
With the challenges of a rapidly growing population and the 2032 Brisbane Olympic and Paralympic Games on the horizon, the new Queensland Government has continued the state’s infrastructure rise for the fourth-year running. Queensland’s general government expenditure allocated to infrastructure has now risen to 15.9 per cent, up 1.7 percentage points from the 2024-25 budget allocation, moving the State’s Share rank from fourth to second.
This four-year allocation is 4.3 per cent above the decade-long average of 11.6 per cent and represents the jurisdiction with the most expansionary infrastructure profile in this 2025-26 Budget Season. This expansion has seen Queensland finish first in the Service metric with a 29 per cent increase in per capita funding growth, 24 percentage points more than the next best jurisdiction, South Australia. Per capita funding has now increased 65 per cent in Queensland since the 2022-23 Budget.
A 20.5 per cent increase on last year’s four-year allocation has had a negative impact on the Stability metric, with the State finishing fifth. Infrastructure funding has now increased by $29.1 billion or 69 per cent since the 2022-23 Budget.
With such a strong pipeline, the Queensland Government will need to carefully manage its budget to ensure capital gets out the door and projects with hard deadlines are delivered on time.
2nd Place: New South Wales
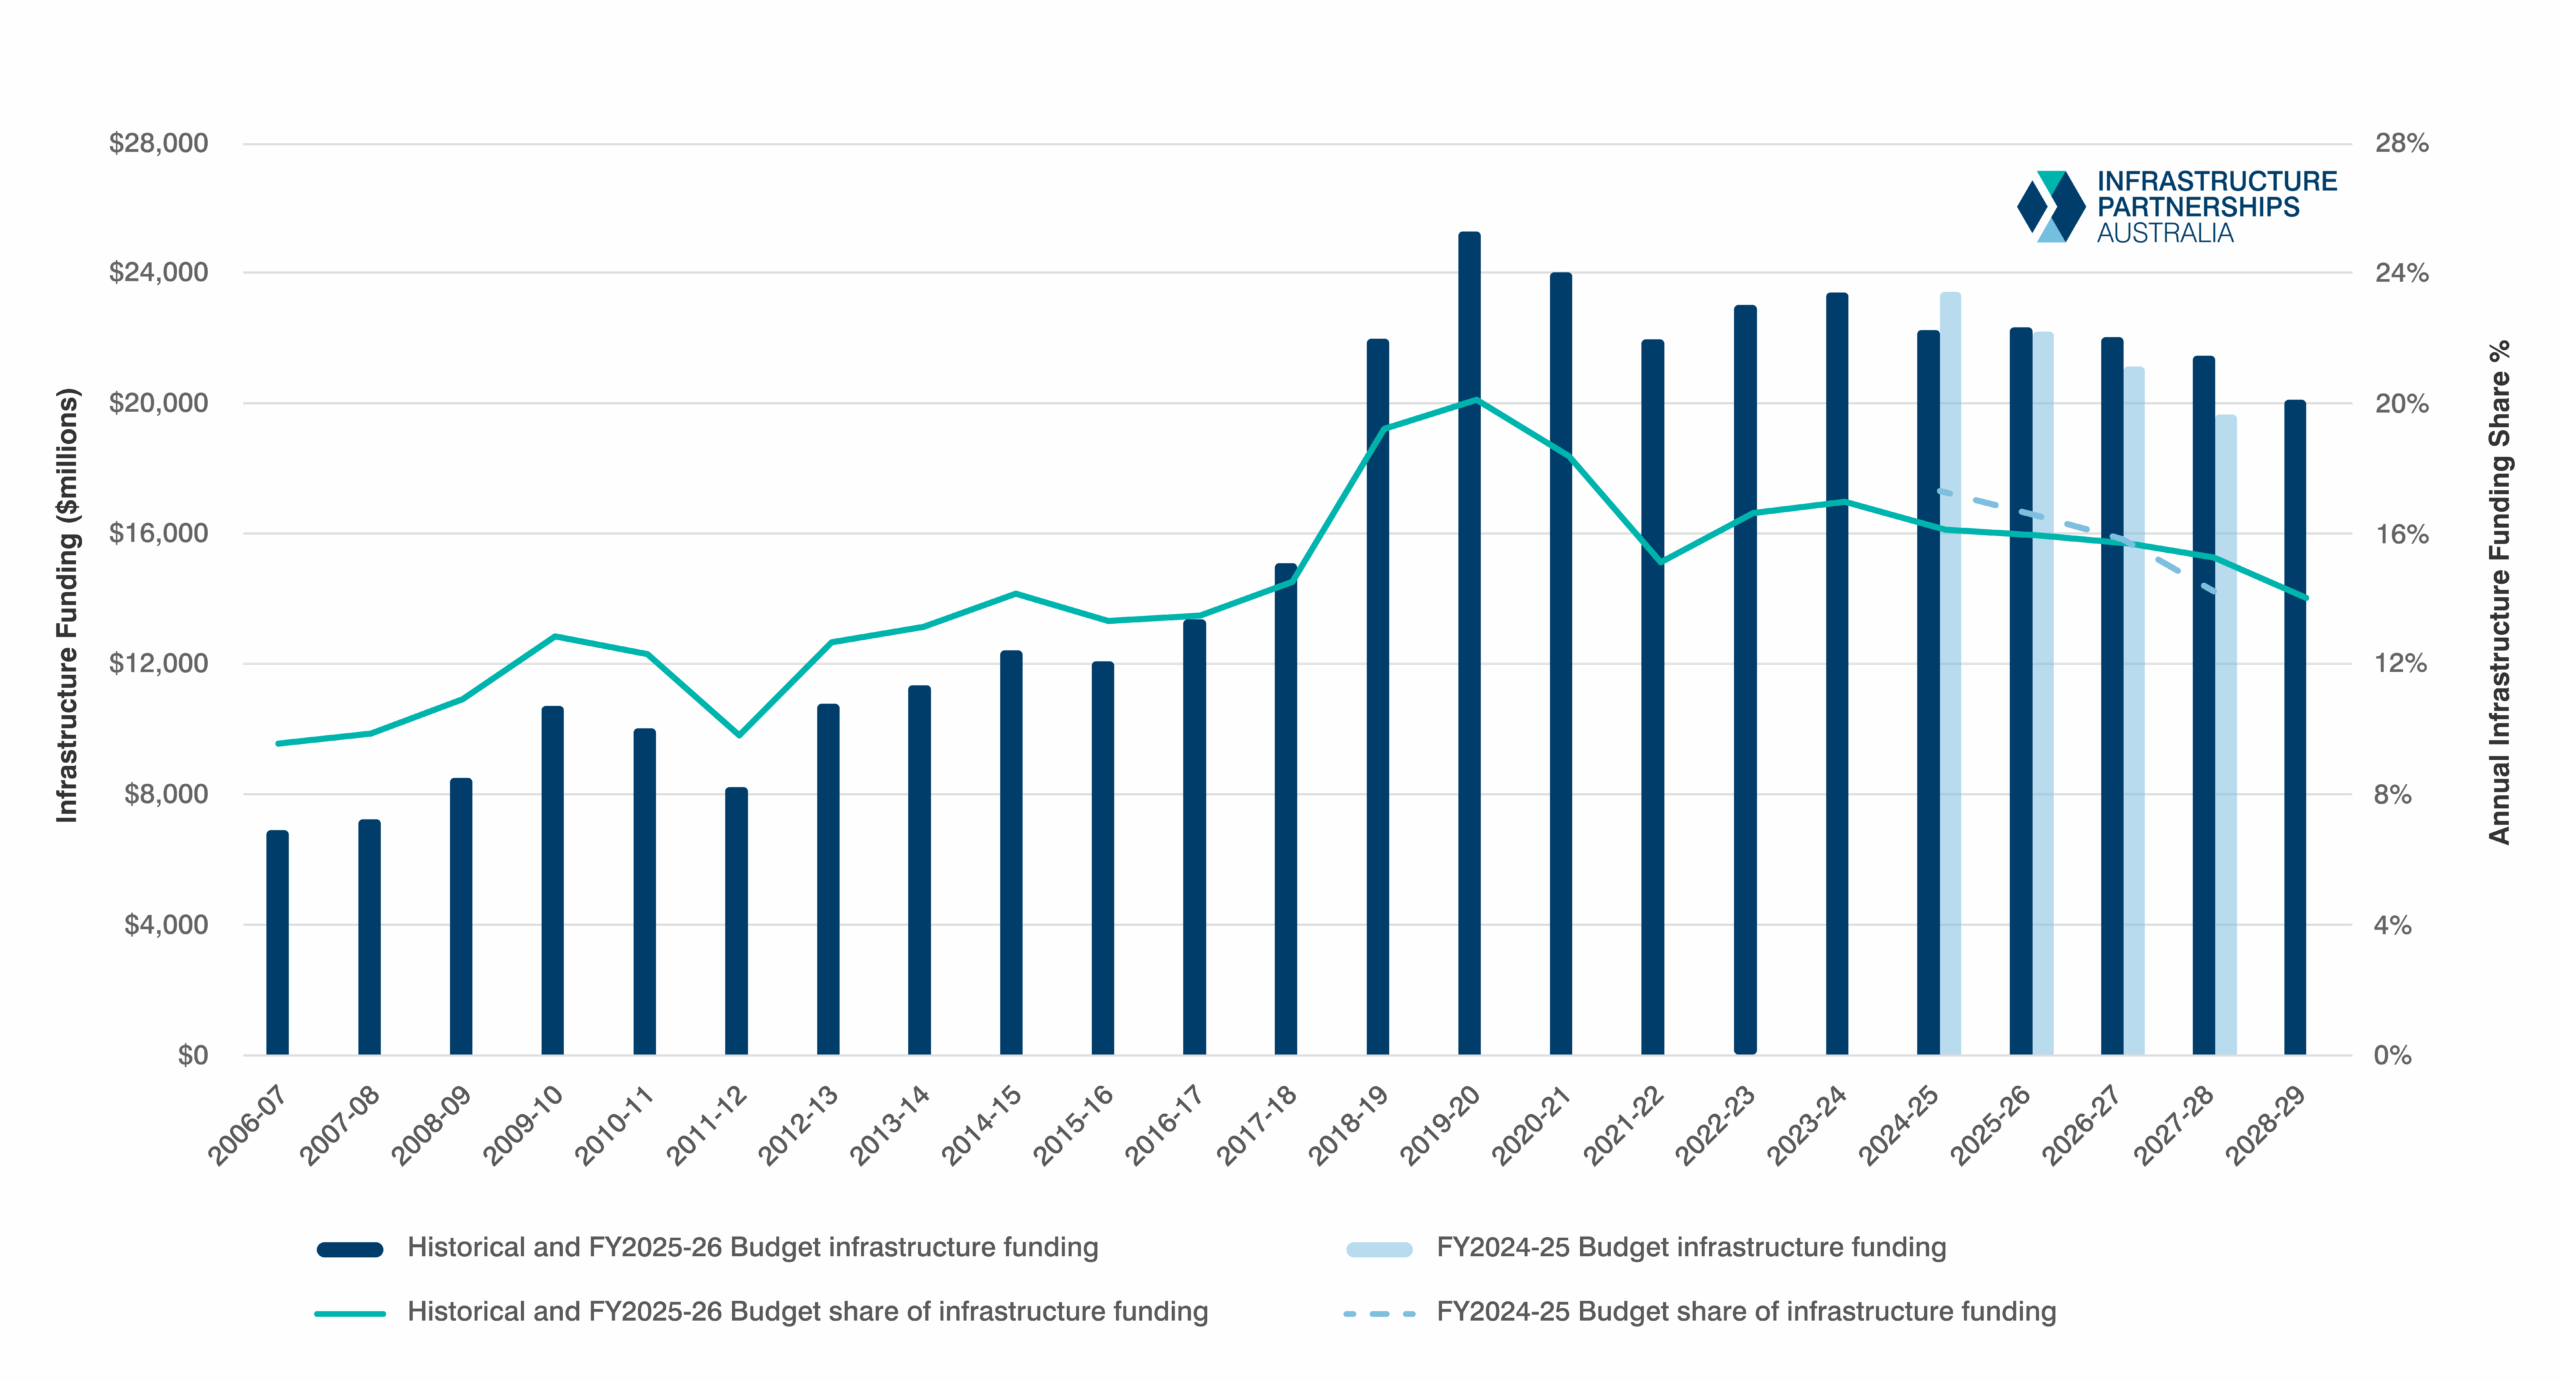
Source: Infrastructure Partnerships Australia analysis of the 2025-26 New South Wales Budget
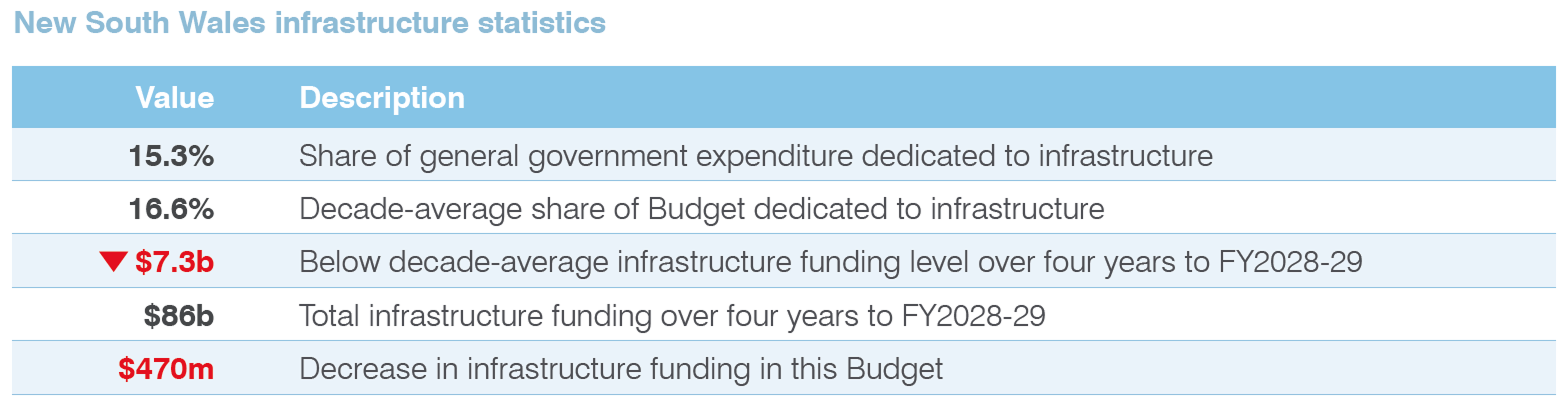
The boom that has underwritten the last 13 years of infrastructure funding in Australia’s largest jurisdiction is now drawing to a measured close, with this Budget allocating $86 billion to infrastructure, $470 million lower than last year’s in nominal terms and $2.2 billion lower in real terms.
A robust pipeline of mega-projects under delivery such as Sydney Metro West, Western Harbour Tunnel, and the Coffs Harbour Bypass continue to provide ballast to the State’s infrastructure allocation. The State’s four-year allocation to infrastructure is equivalent to 15.3 per cent of general government expenditure, achieving a Share rank of third, one position lower than last year, when 16 per cent of general government expenditure was allocated to infrastructure.
The declining share of infrastructure expenditure aligns with the long-term goal of the Minns Government to reduce infrastructure expenditure to two per cent of Gross State Product. The policy, first announced in the 2023-24 NSW Budget, initially aimed to reach this target by FY2026-27, has now been extended to FY2028-29. This steady approach to managing decline sees the state rank first in Stability.
NSW’s four-year allocation is now 1.3 percentage points below the previous decade average of 16.6 per cent, resulting in a ranking of fourth in the Spread metric.
3rd Place: Victoria
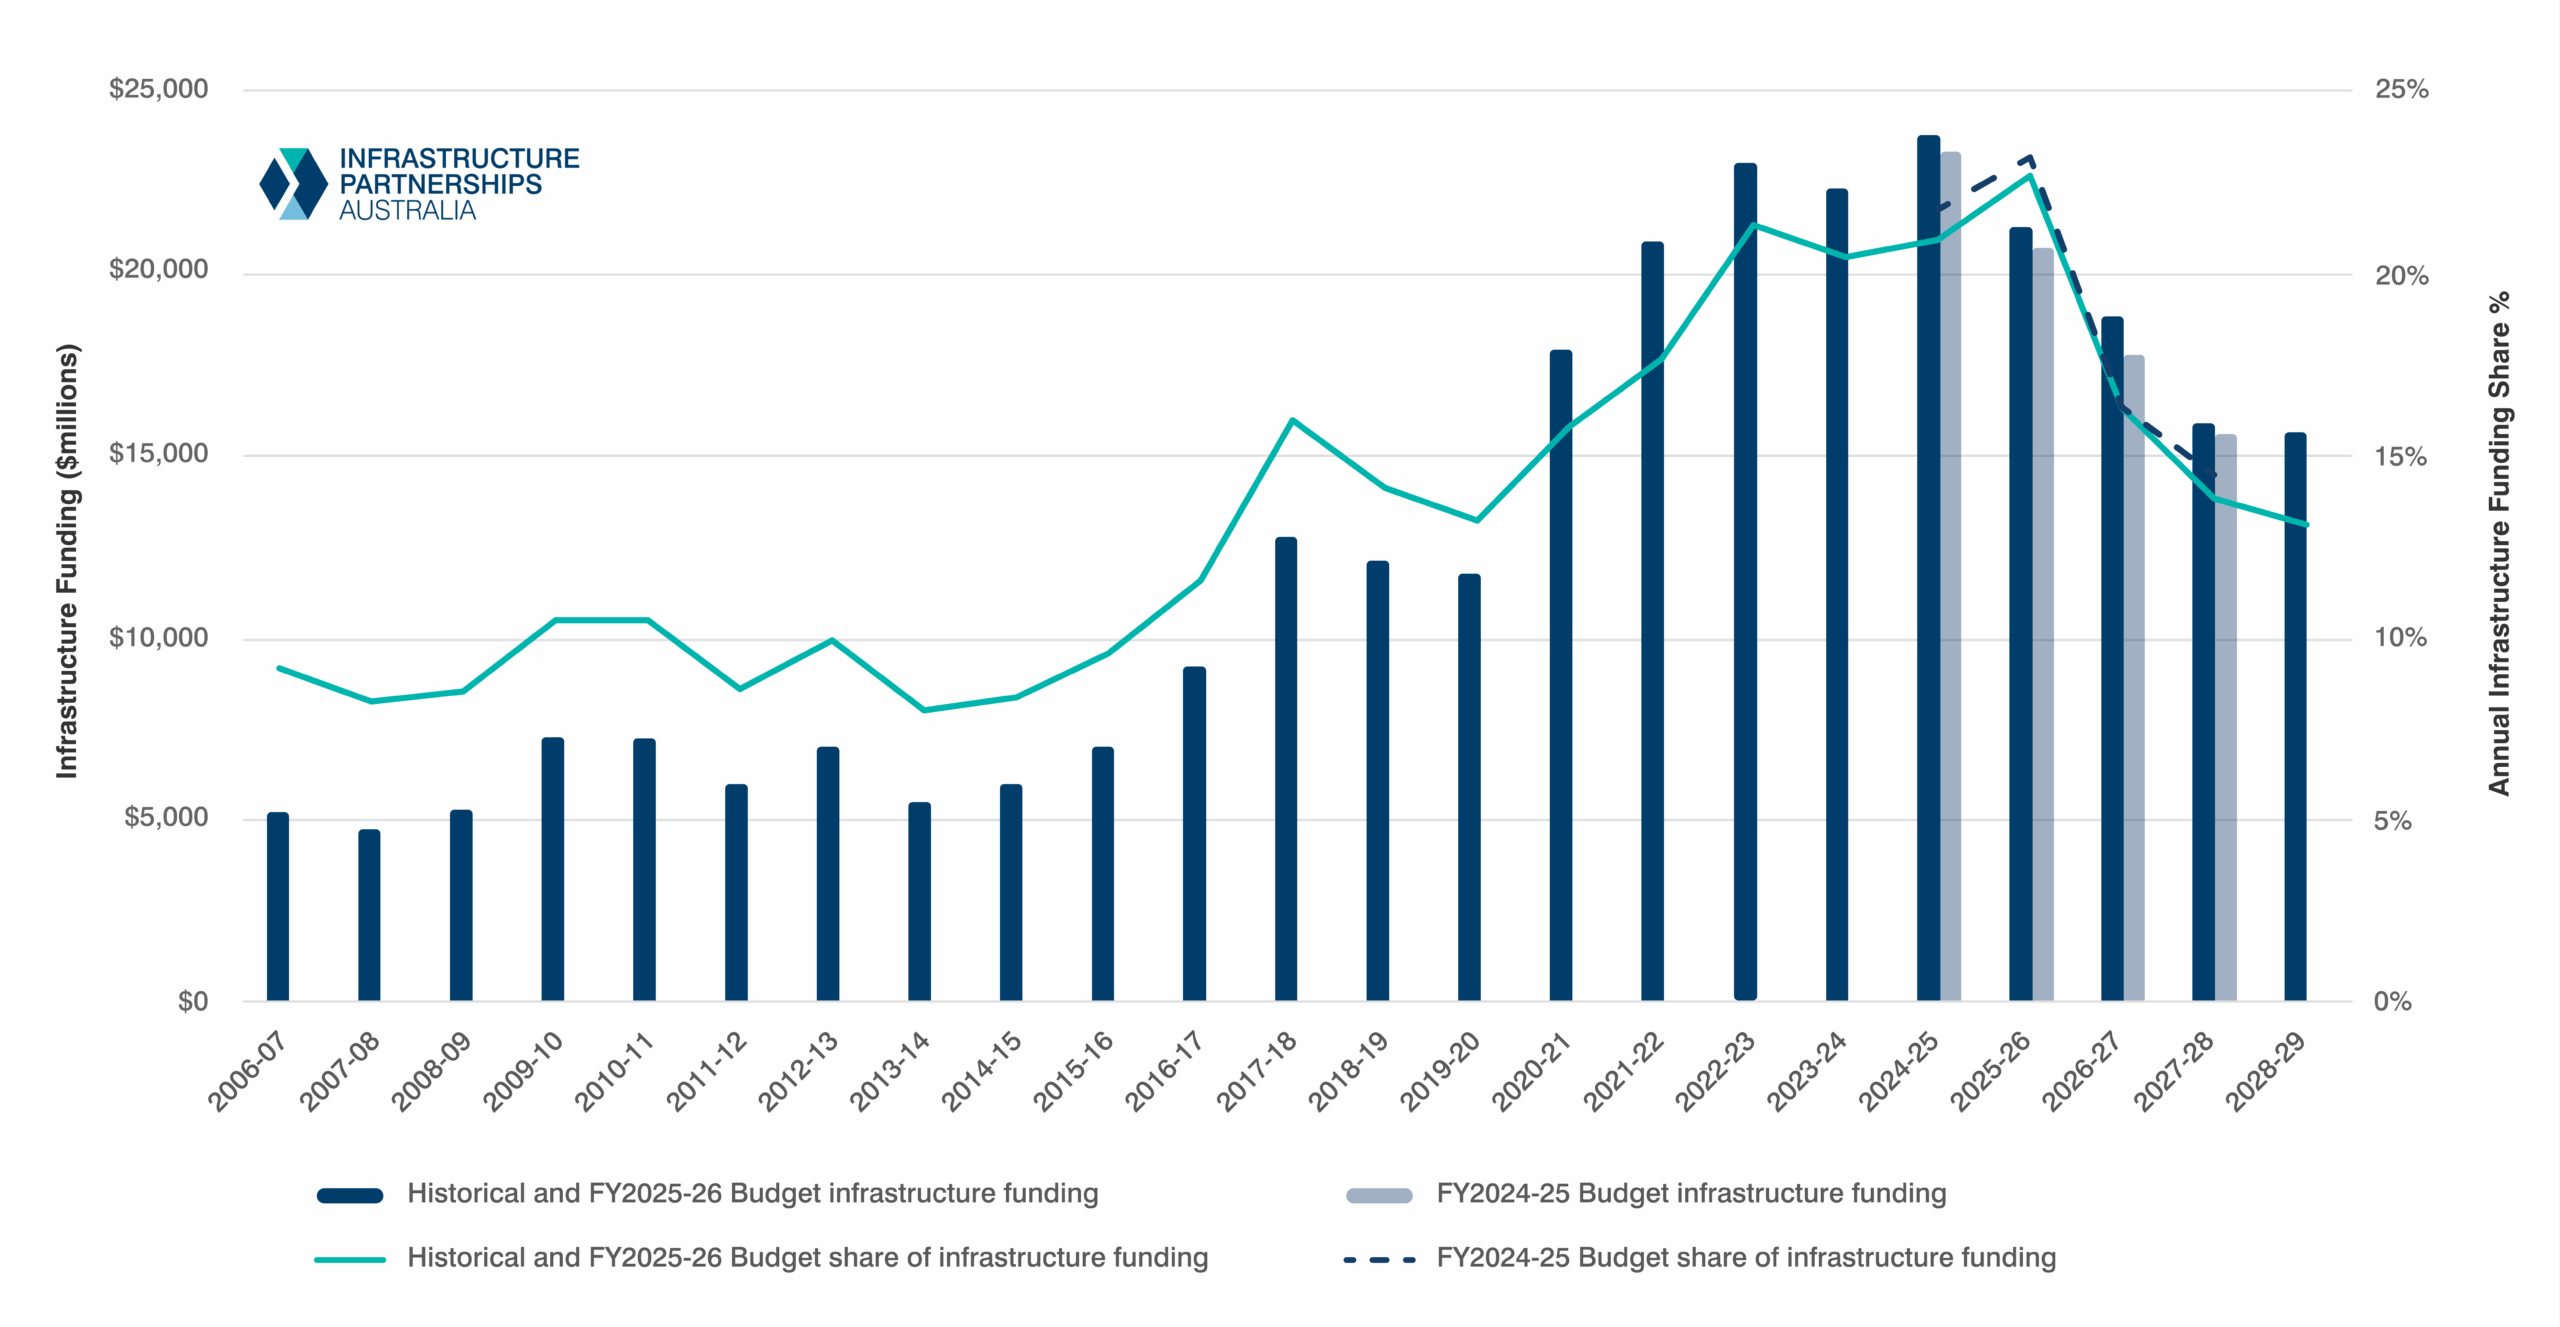
Source: Infrastructure Partnerships Australia analysis of the 2025-26 Victorian Budget
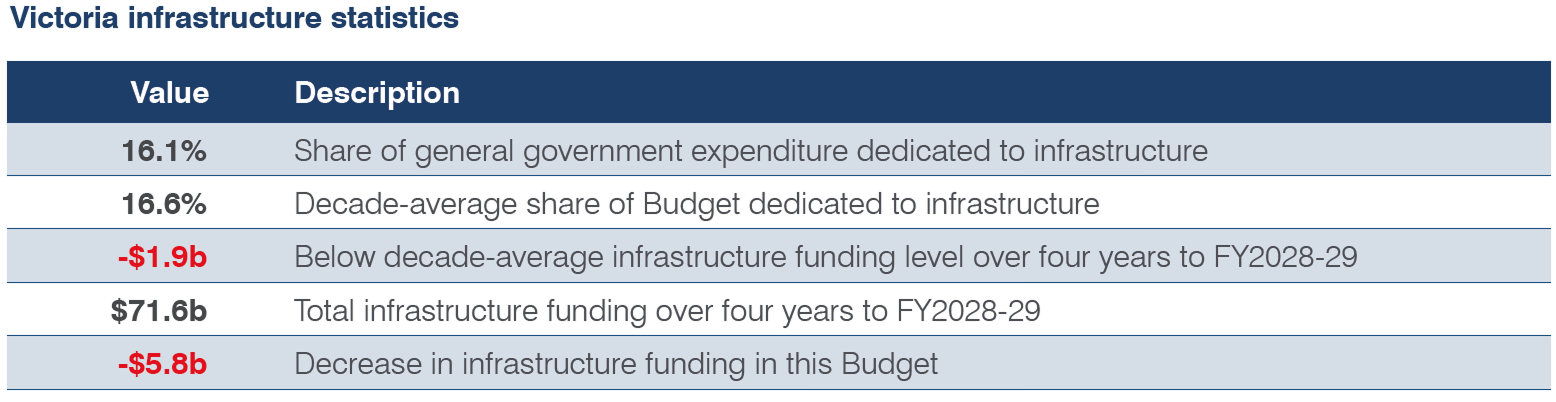
For the fifth year in a row Victoria has finished first in the Share metric, allocating $71.6 billion to infrastructure over the next four years, equivalent to 16.1 per cent of general government expenditure. However, this allocation is a far cry from the $107.4 billion (in real terms), or 24 per cent of general government expenditure allocated in the 2021-22 Budget.
Despite ranking first in the Share metric, the bulk of infrastructure funding over the next four years is tail funding or previously unfunded cost overruns for major projects under delivery, and expected to be complete in this Budget period, including North East Link, Melbourne Metro Tunnel and the West Gate Tunnel. New projects in this Budget were headlined by a $2.2 billion reallocation of existing funding to the Sunshine Superhub.
In real terms, infrastructure funding in Victoria over the next four years is forecast to be $18.4 billion less than the previous four years. This precipitous contraction in infrastructure allocations has seen Victoria ranked fourth in Stability ahead of only the rapidly expanding Queensland and South Australia.
Victoria’s performance in metrics assessing the cyclical position of jurisdictions demonstrates the downside risks associated with making rapid changes to infrastructure funding. Future infrastructure funding decisions in Victoria are now seriously limited by the State’s fiscal capacity, and are likely to lead to further falls in the Budget Monitor rankings.
4th Place: South Australia
Source: Infrastructure Partnerships Australia analysis of the 2025-26 South Australia Budget
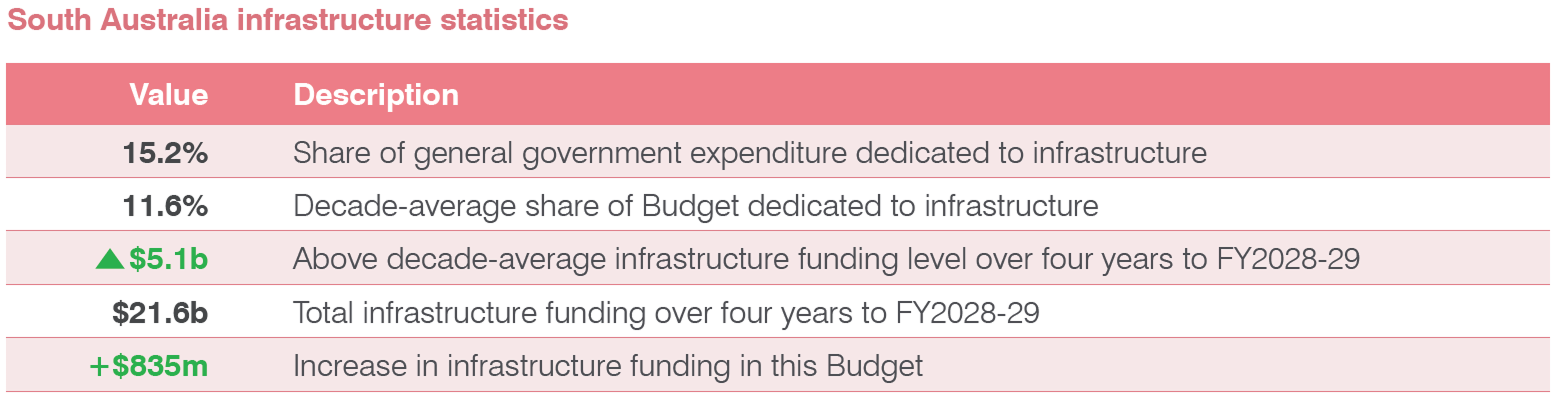
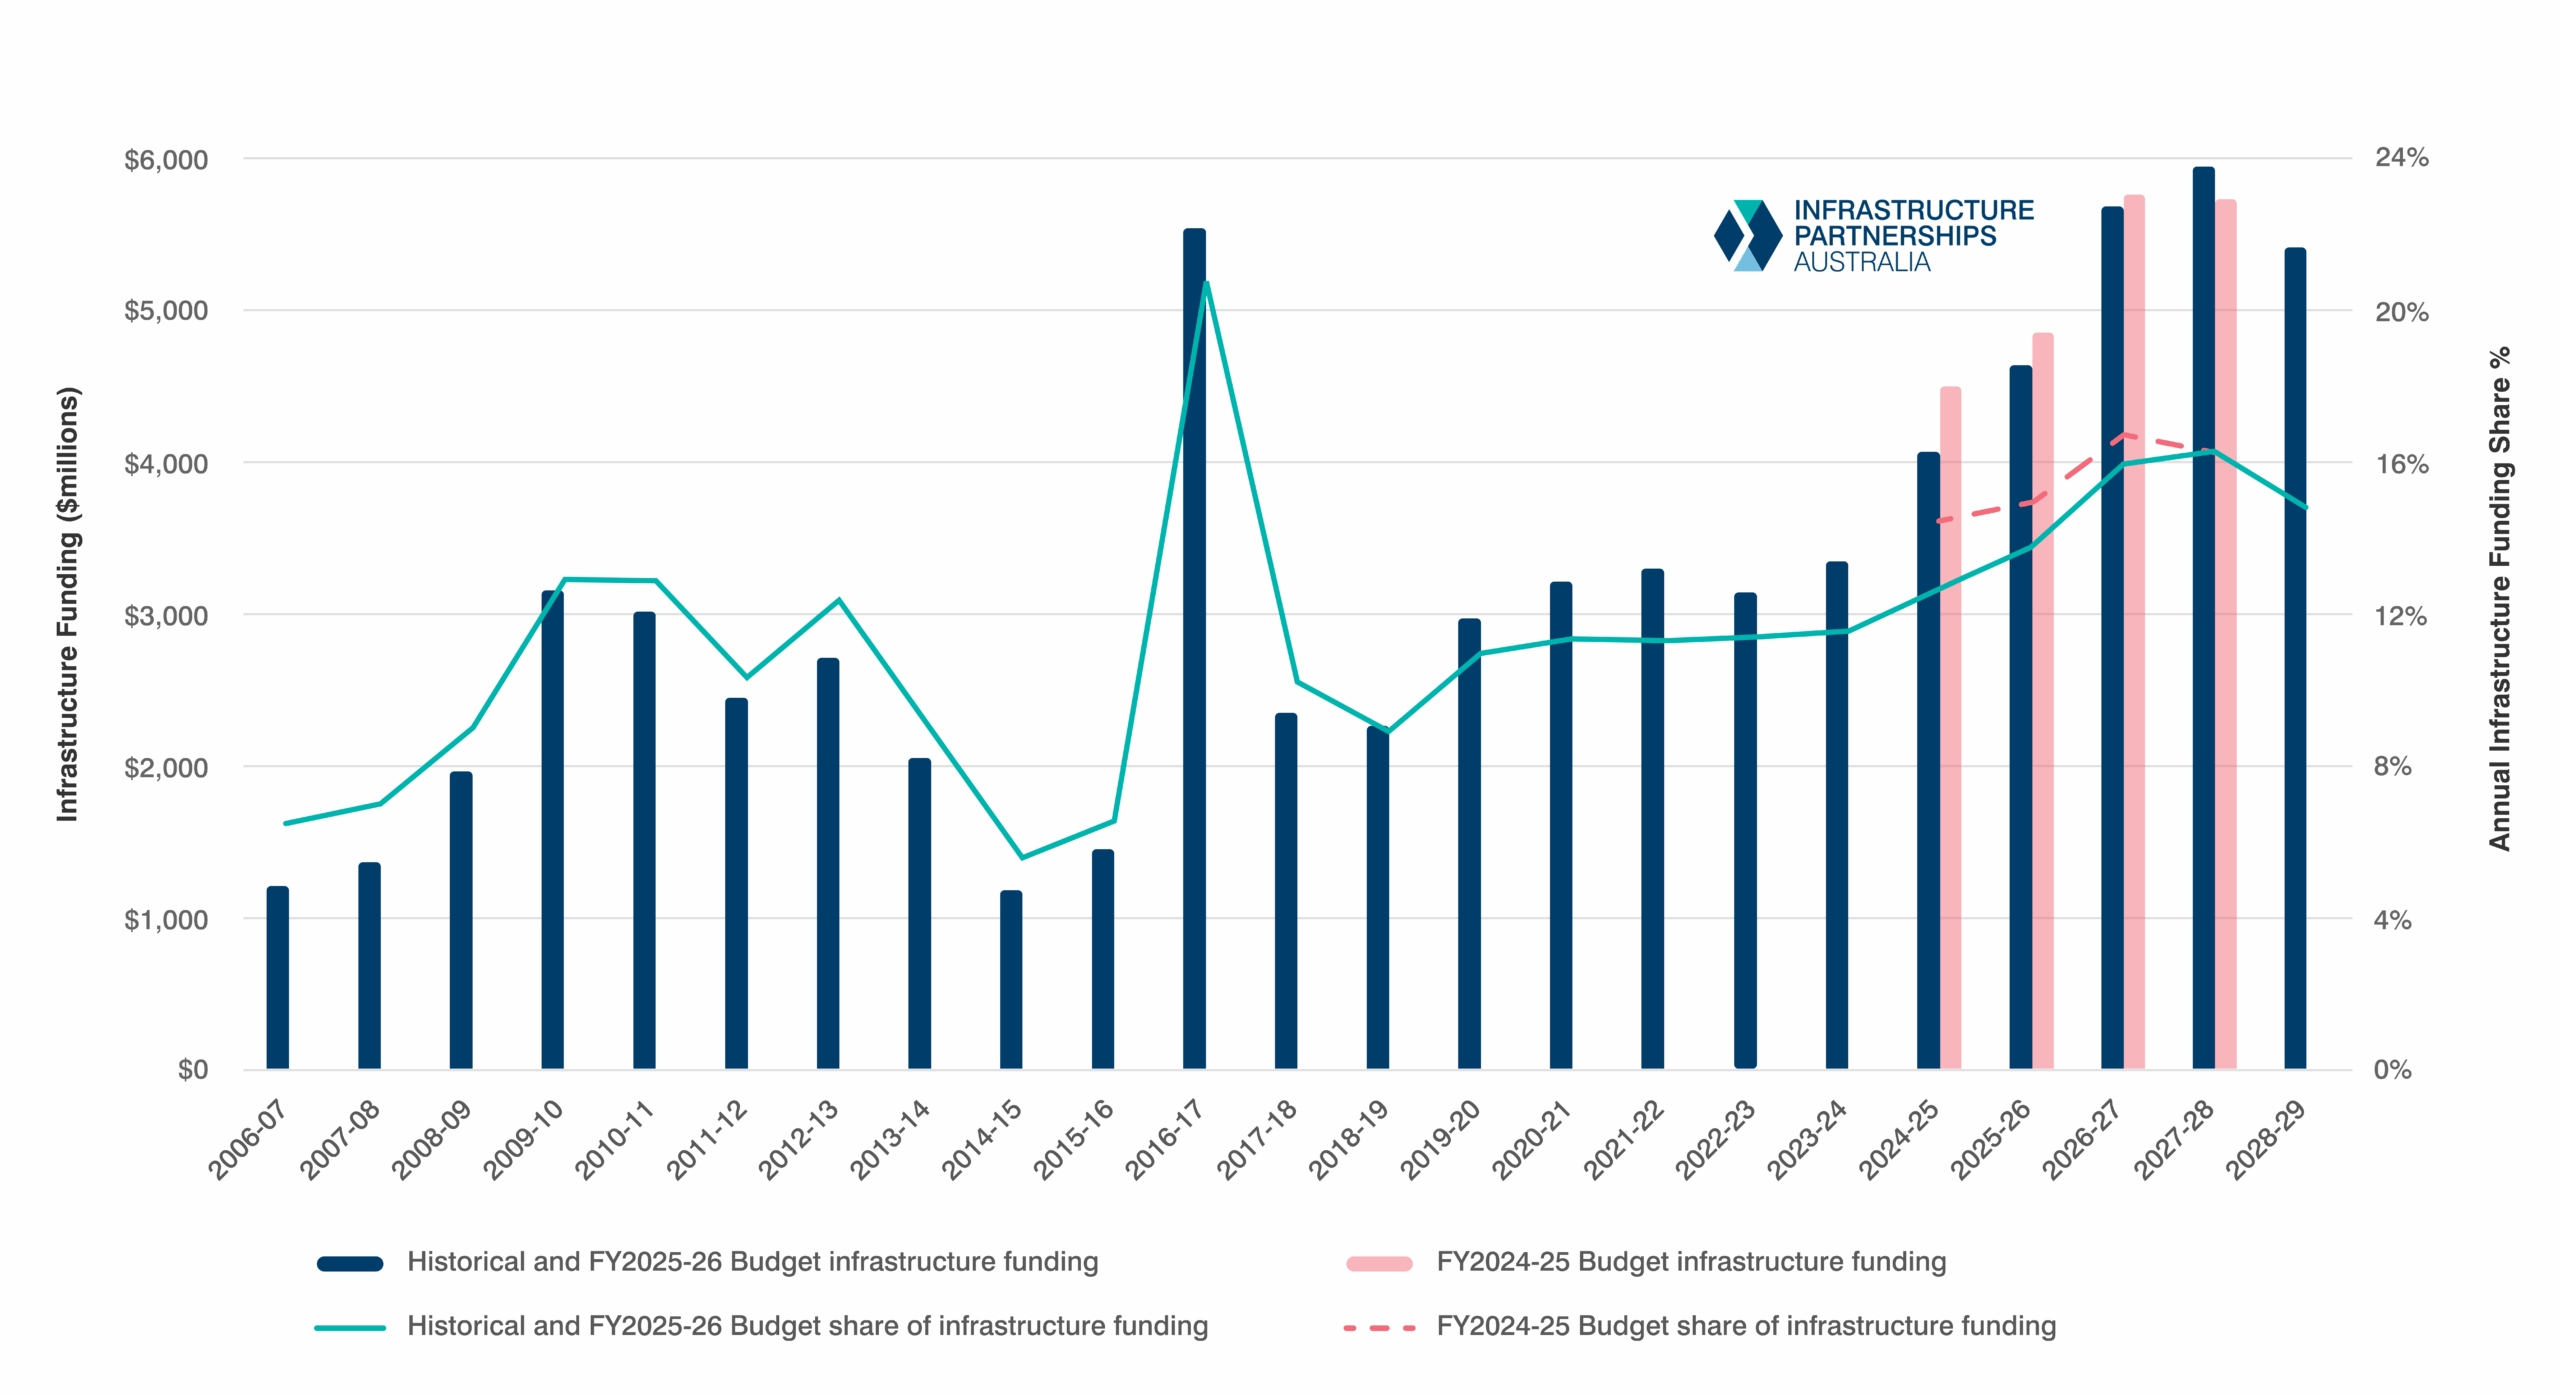
South Australia is currently in the early stages of an expansionary period, with two very large projects in the Torrens to Darlington and the New Women’s and Children’s Hospital expected to reach peak mobilisation this budget period. Allocations to these two projects see the state’s four-year allocation rise to $21.6 billion, equivalent to 15.2 per cent of general government expenditure, and 3.6 per cent above the decade average, resulting in a Share rank of fourth and a Spread rank of second.
This rapid expansion means that South Australia finishes last for Stability, with the next four years of infrastructure spending differing more from the previous four years of allocations than in any other Australian jurisdiction.
Despite increasing rapidly, this expansion follows a period of subdued investment in infrastructure, meaning the State only finishes with a Share rank of fourth. With the contracting Victoria and NSW only slightly above South Australia in the rankings, it is likely that the State will climb higher in the Share metric and consequently in the overall rankings in future editions of the Budget Monitor.
5th Place: Tasmania
Source: Infrastructure Partnerships Australia analysis of the 2025-26 Tasmanian Budget
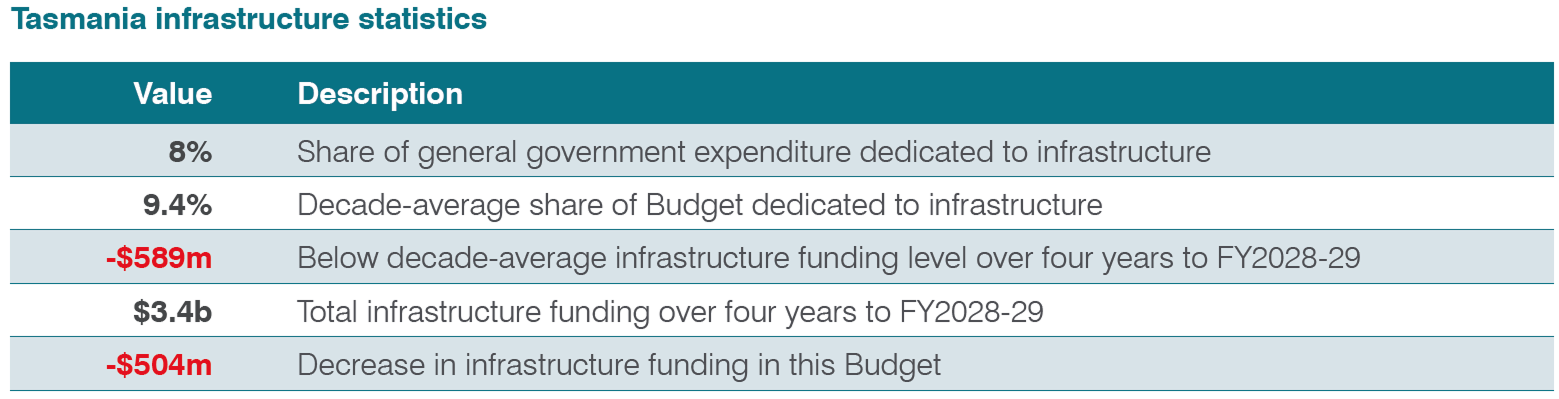
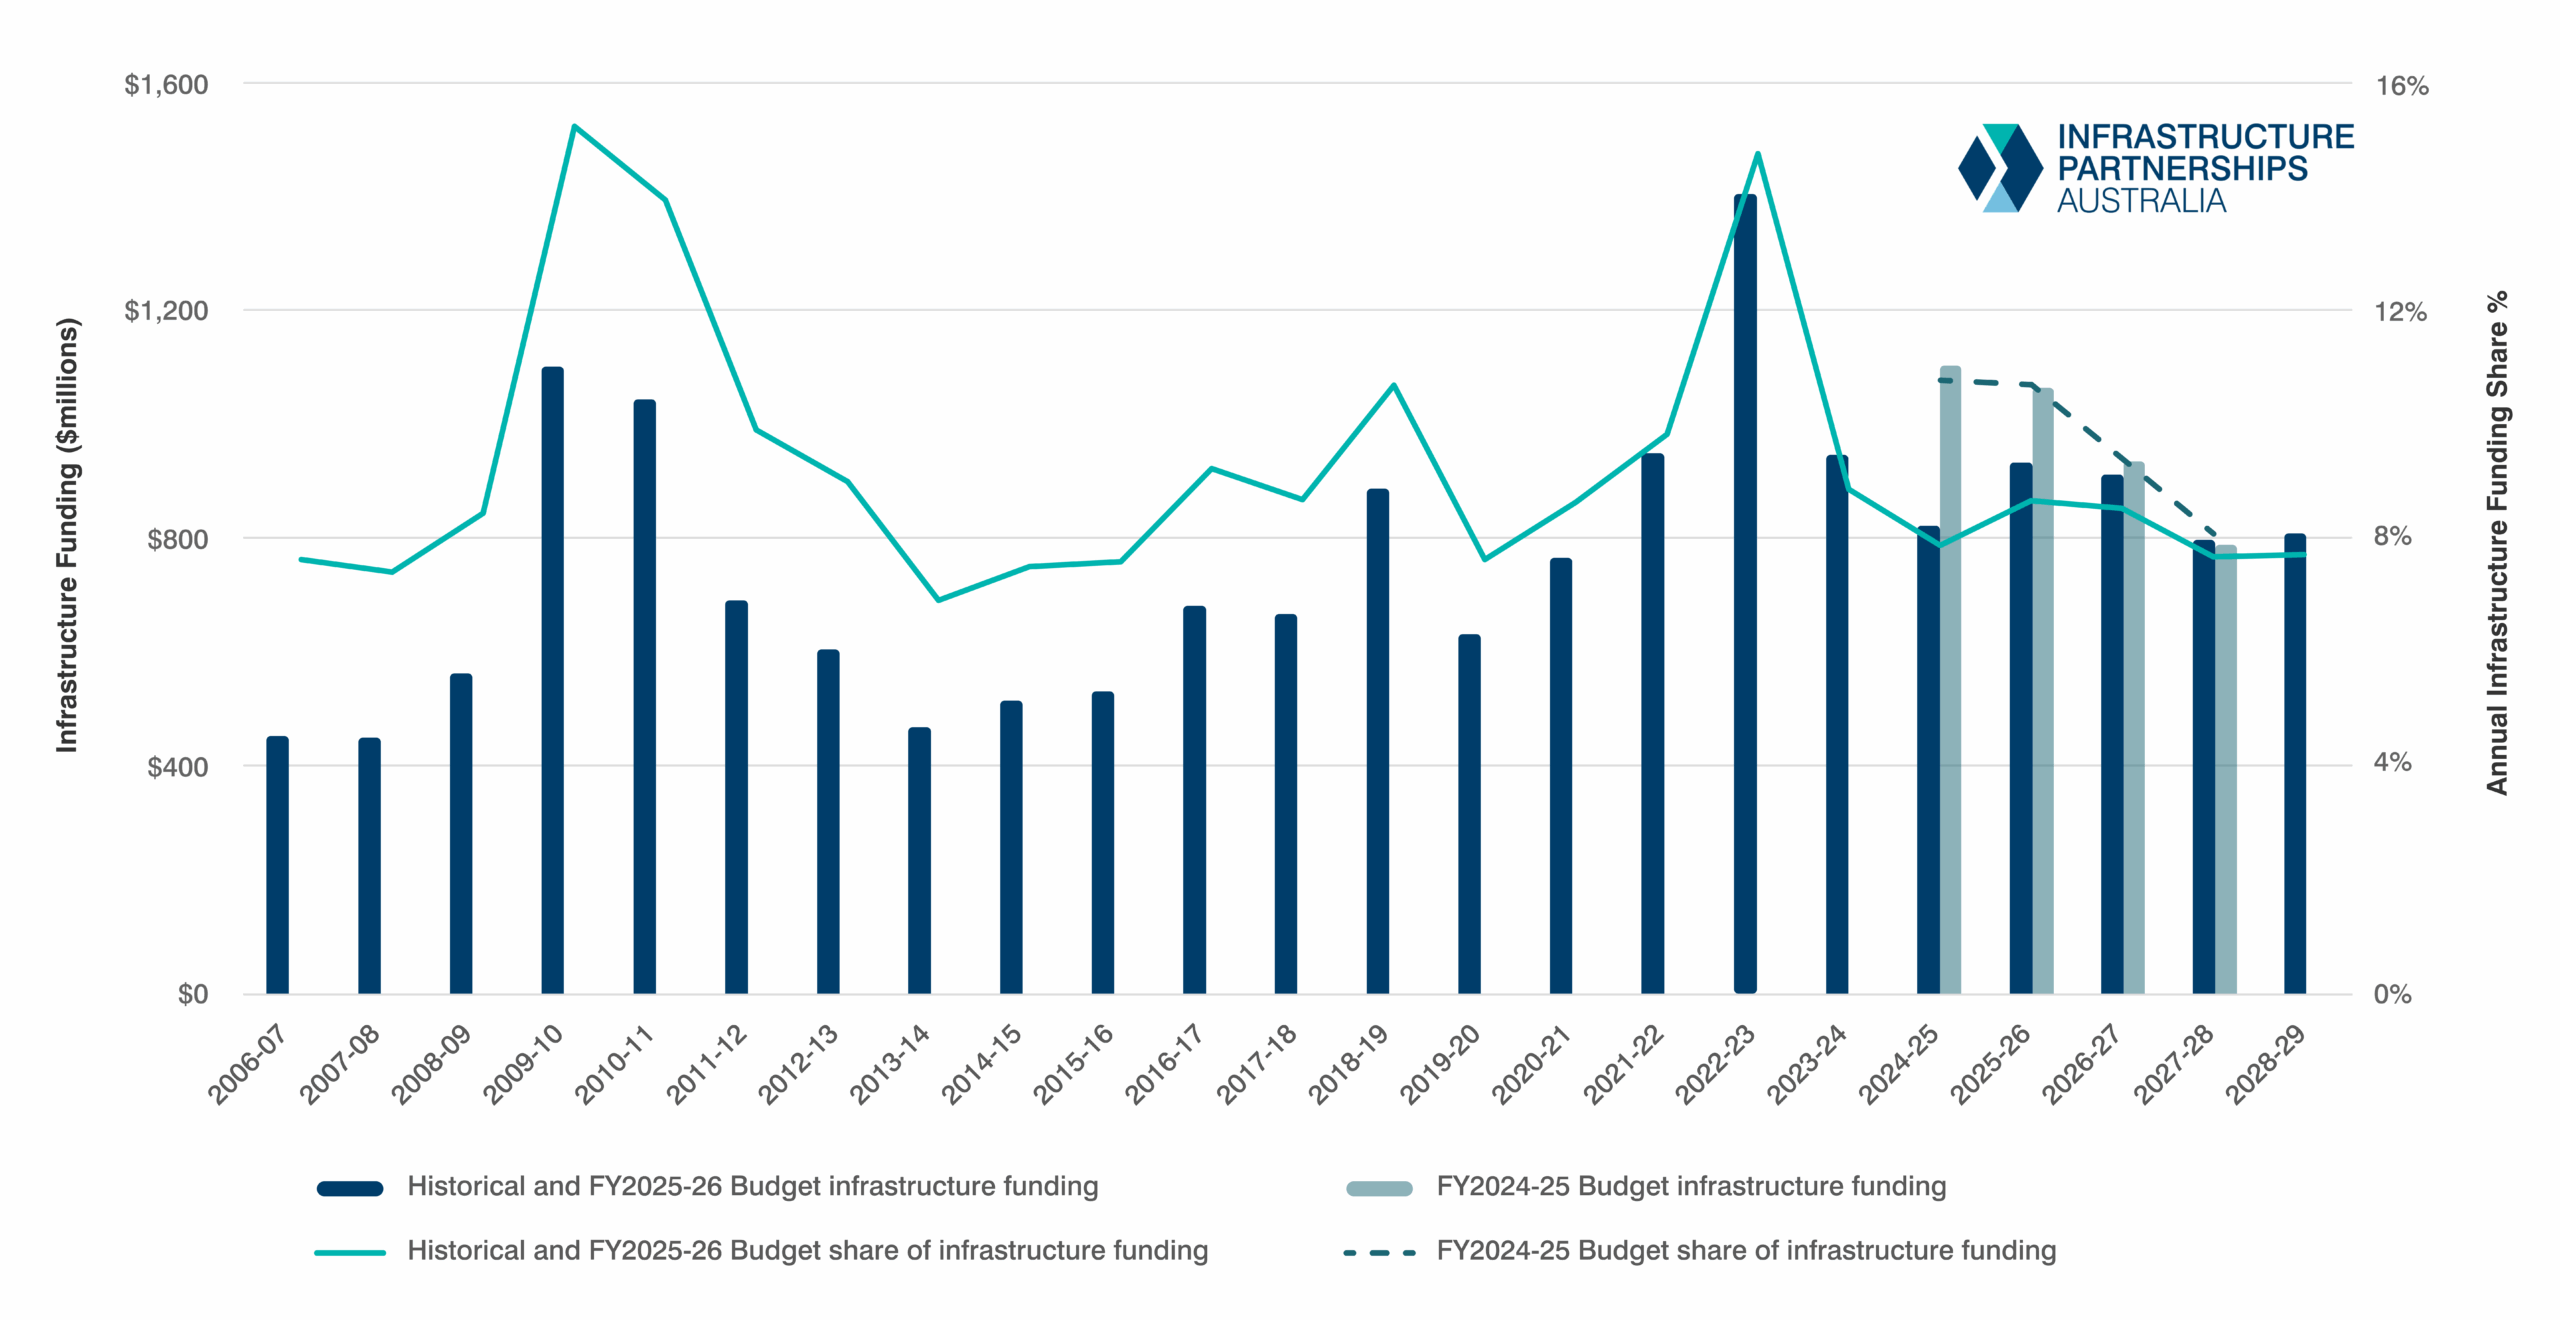
Political instability in Tasmania led to an interim Budget being handed down in November, following the Tasmanian election in July, and after the Budget handed down in May and supporting Appropriations Bills were not passed prior to the prorogation of the previous Parliament. This Interim Budget allocated just $3.4 billion to infrastructure over the four years to FY2028-29, a 13 per cent decrease on last year’s allocation, and resulting in a Share rank of fifth.
This funding reduction sees Tasmania’s infrastructure funding drop 1.4 per cent below the long-term average, equating to a rank of fifth in the Spread metric.
Per capita funding in Tasmania decreased 11.4 per cent compared to last year’s infrastructure allocation from $6,800 to $6,000 resulting in a Service rank of sixth. Tasmania has the second lowest per capita funding of any jurisdiction.
6th Place: Western Australia
Source: Infrastructure Partnerships Australia analysis of the 2025-26 Western Australia Budget
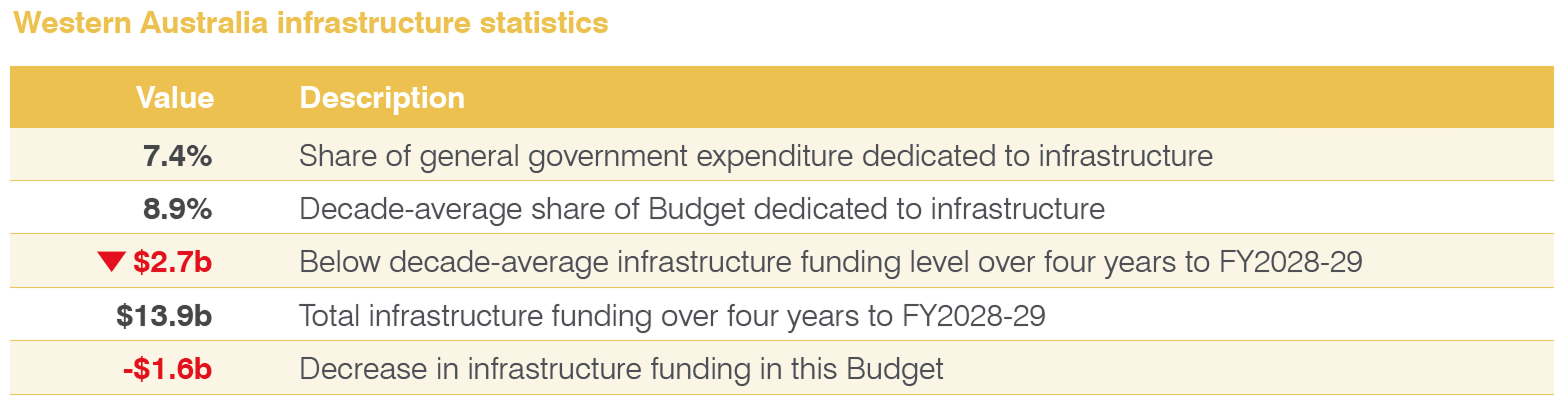
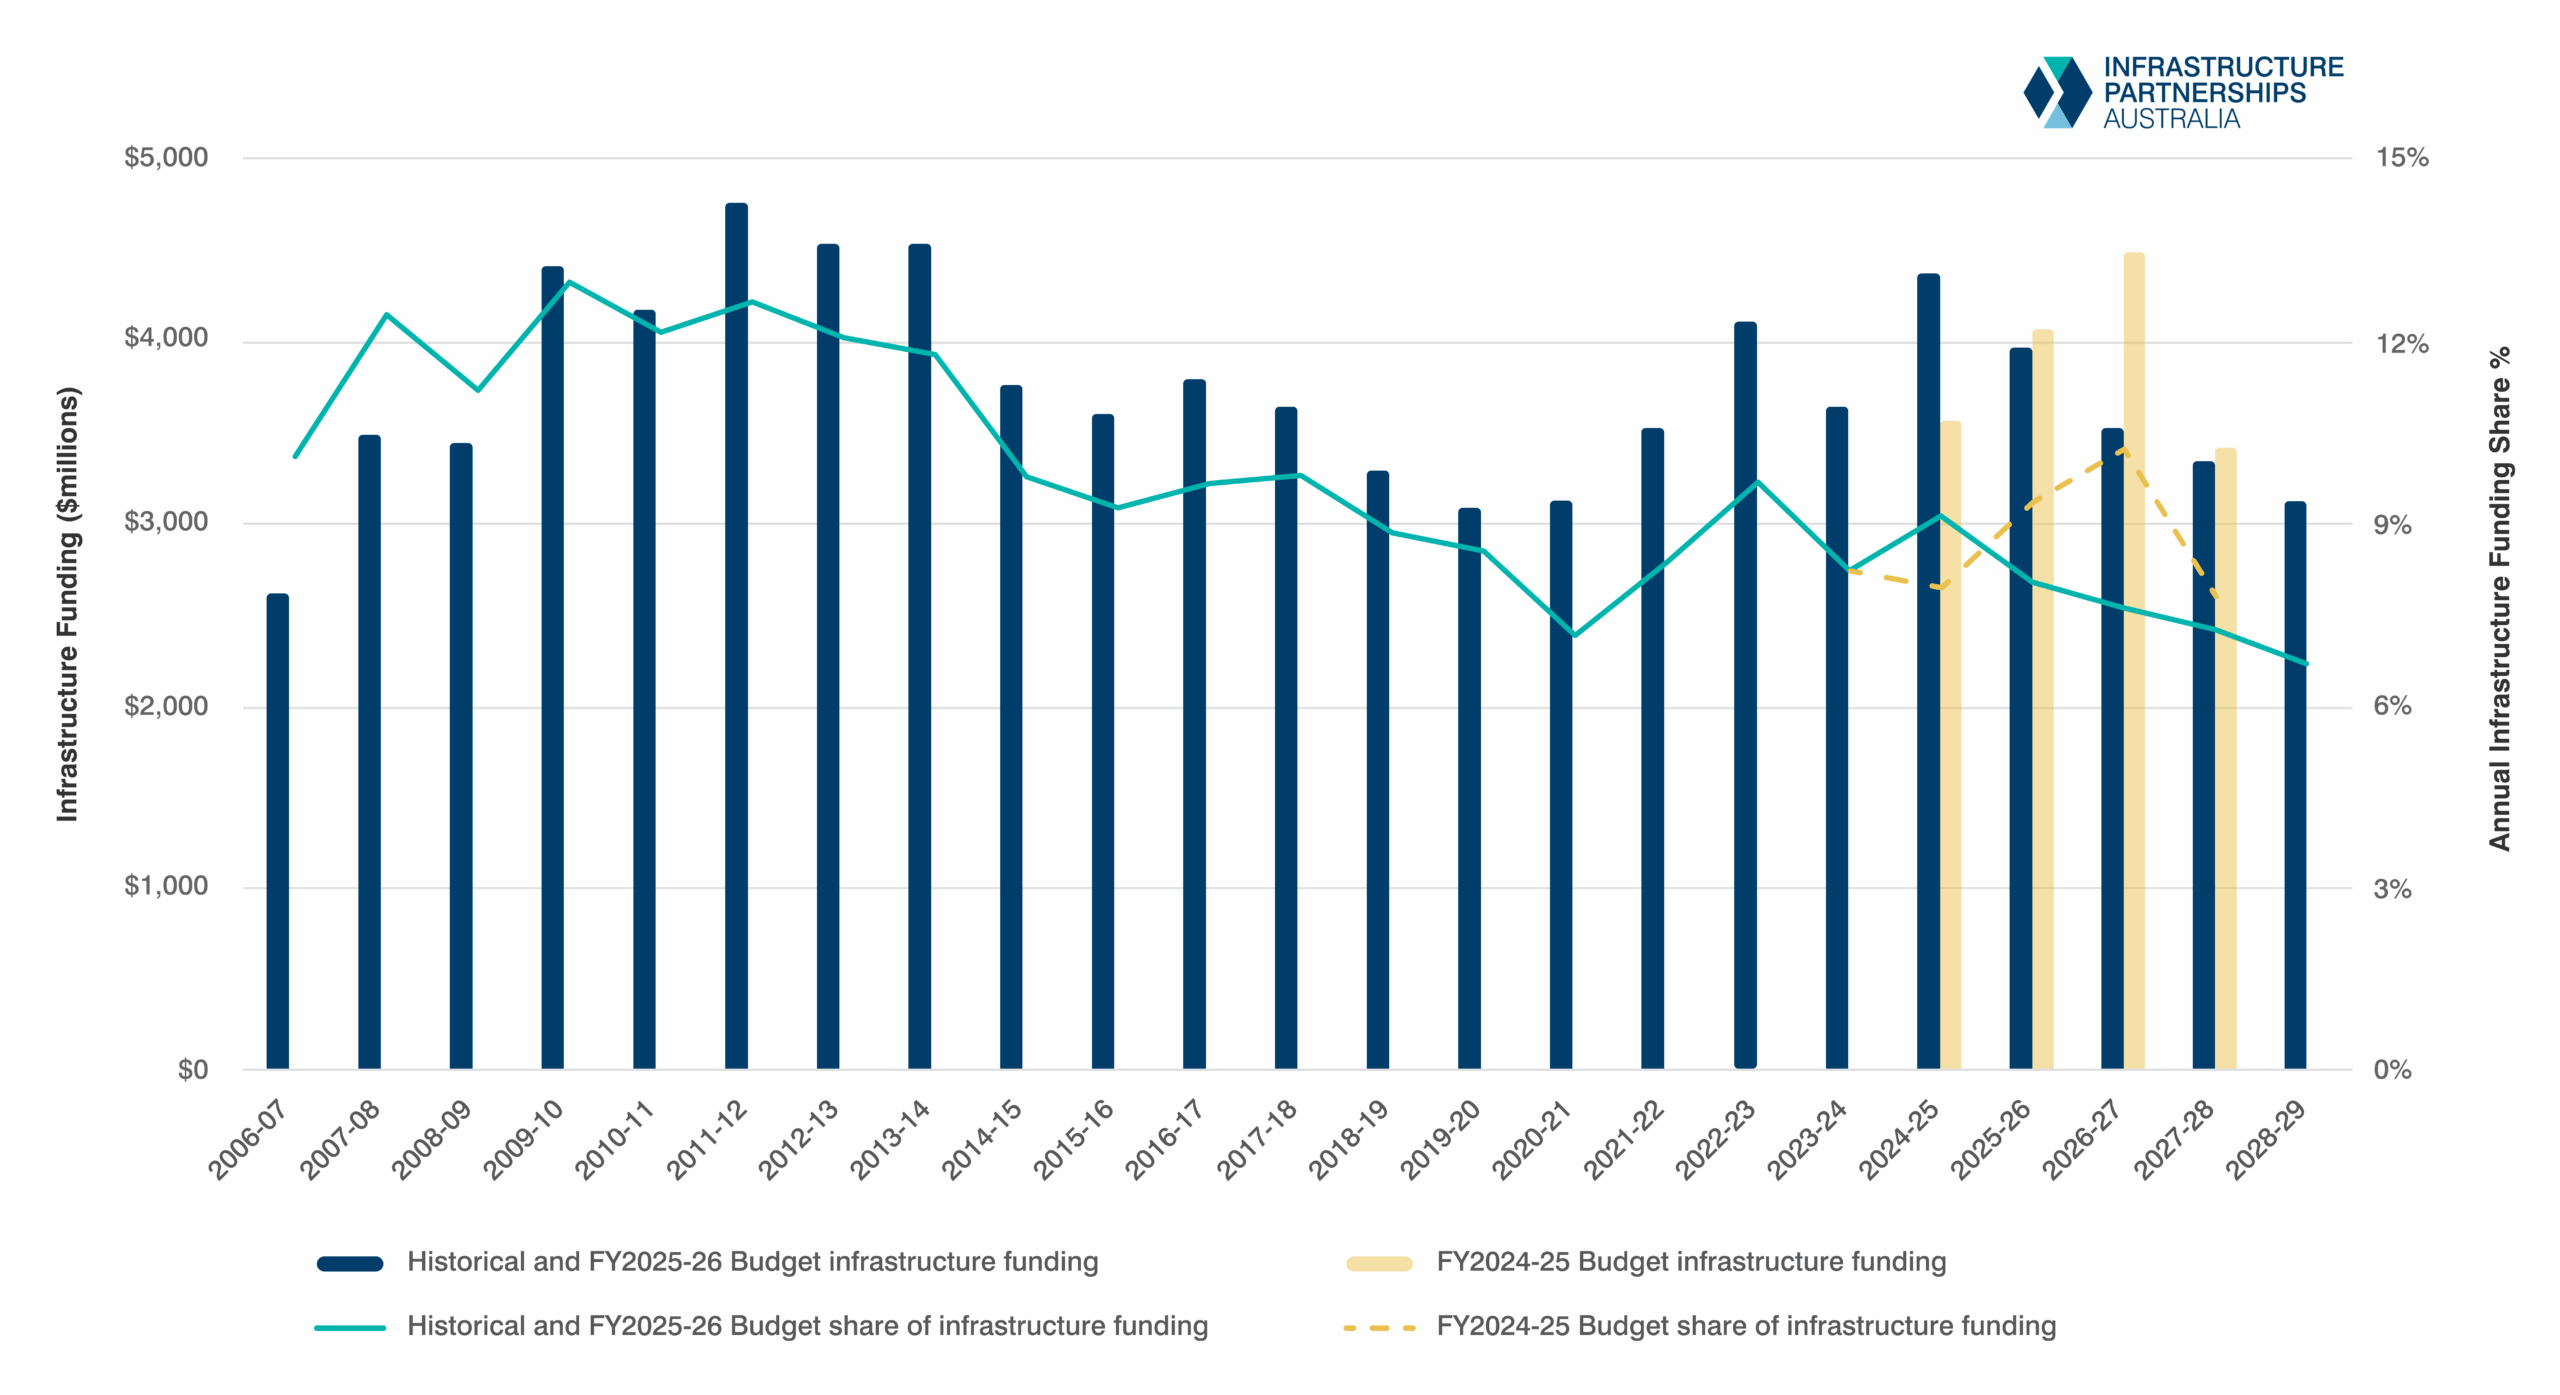
The Government of Western Australian allocated just 7.4 per cent of general government expenditure to infrastructure this year, a 1.4 percentage point decrease on the 2024-25 Budget allocation and 1.4 percentage points below the State’s 10-year average, resulting in Western Australia finishing last in both the Share and Spread metrics.
WA has achieved a Stability score of -5.8. Against a backdrop of other rapidly expanding and rapidly contracting markets, WA has managed to slide into second position in the metric.
WA is ranked fifth in the Service metric, with per capita funding falling 10.4 per cent to $4,700, the lowest per capita infrastructure funding of any jurisdiction.
Federal Government
Source: Infrastructure Partnerships Australia analysis of the 2025-26 Federal Government Budget
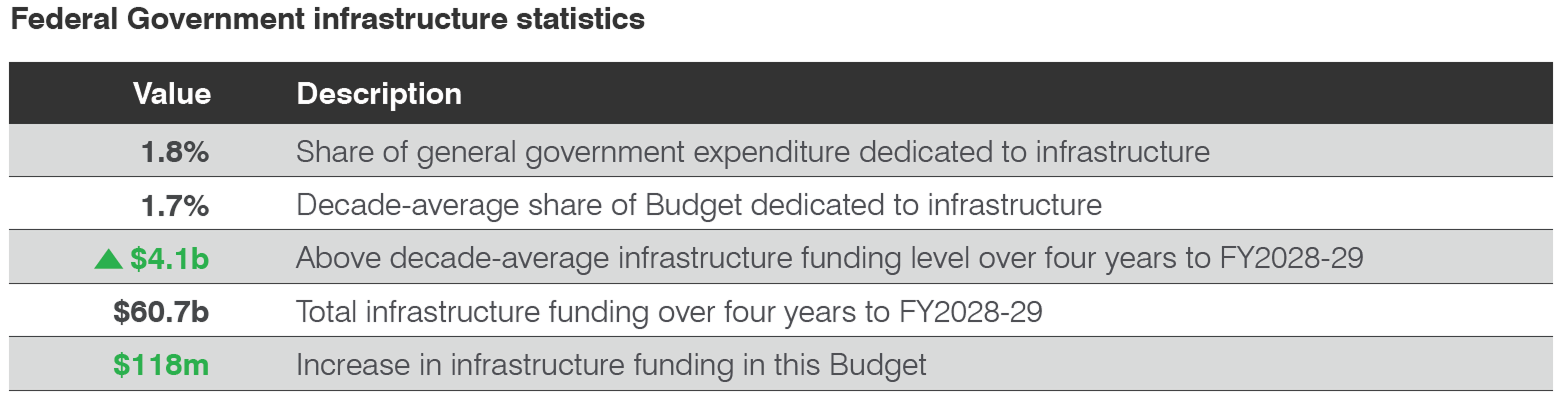
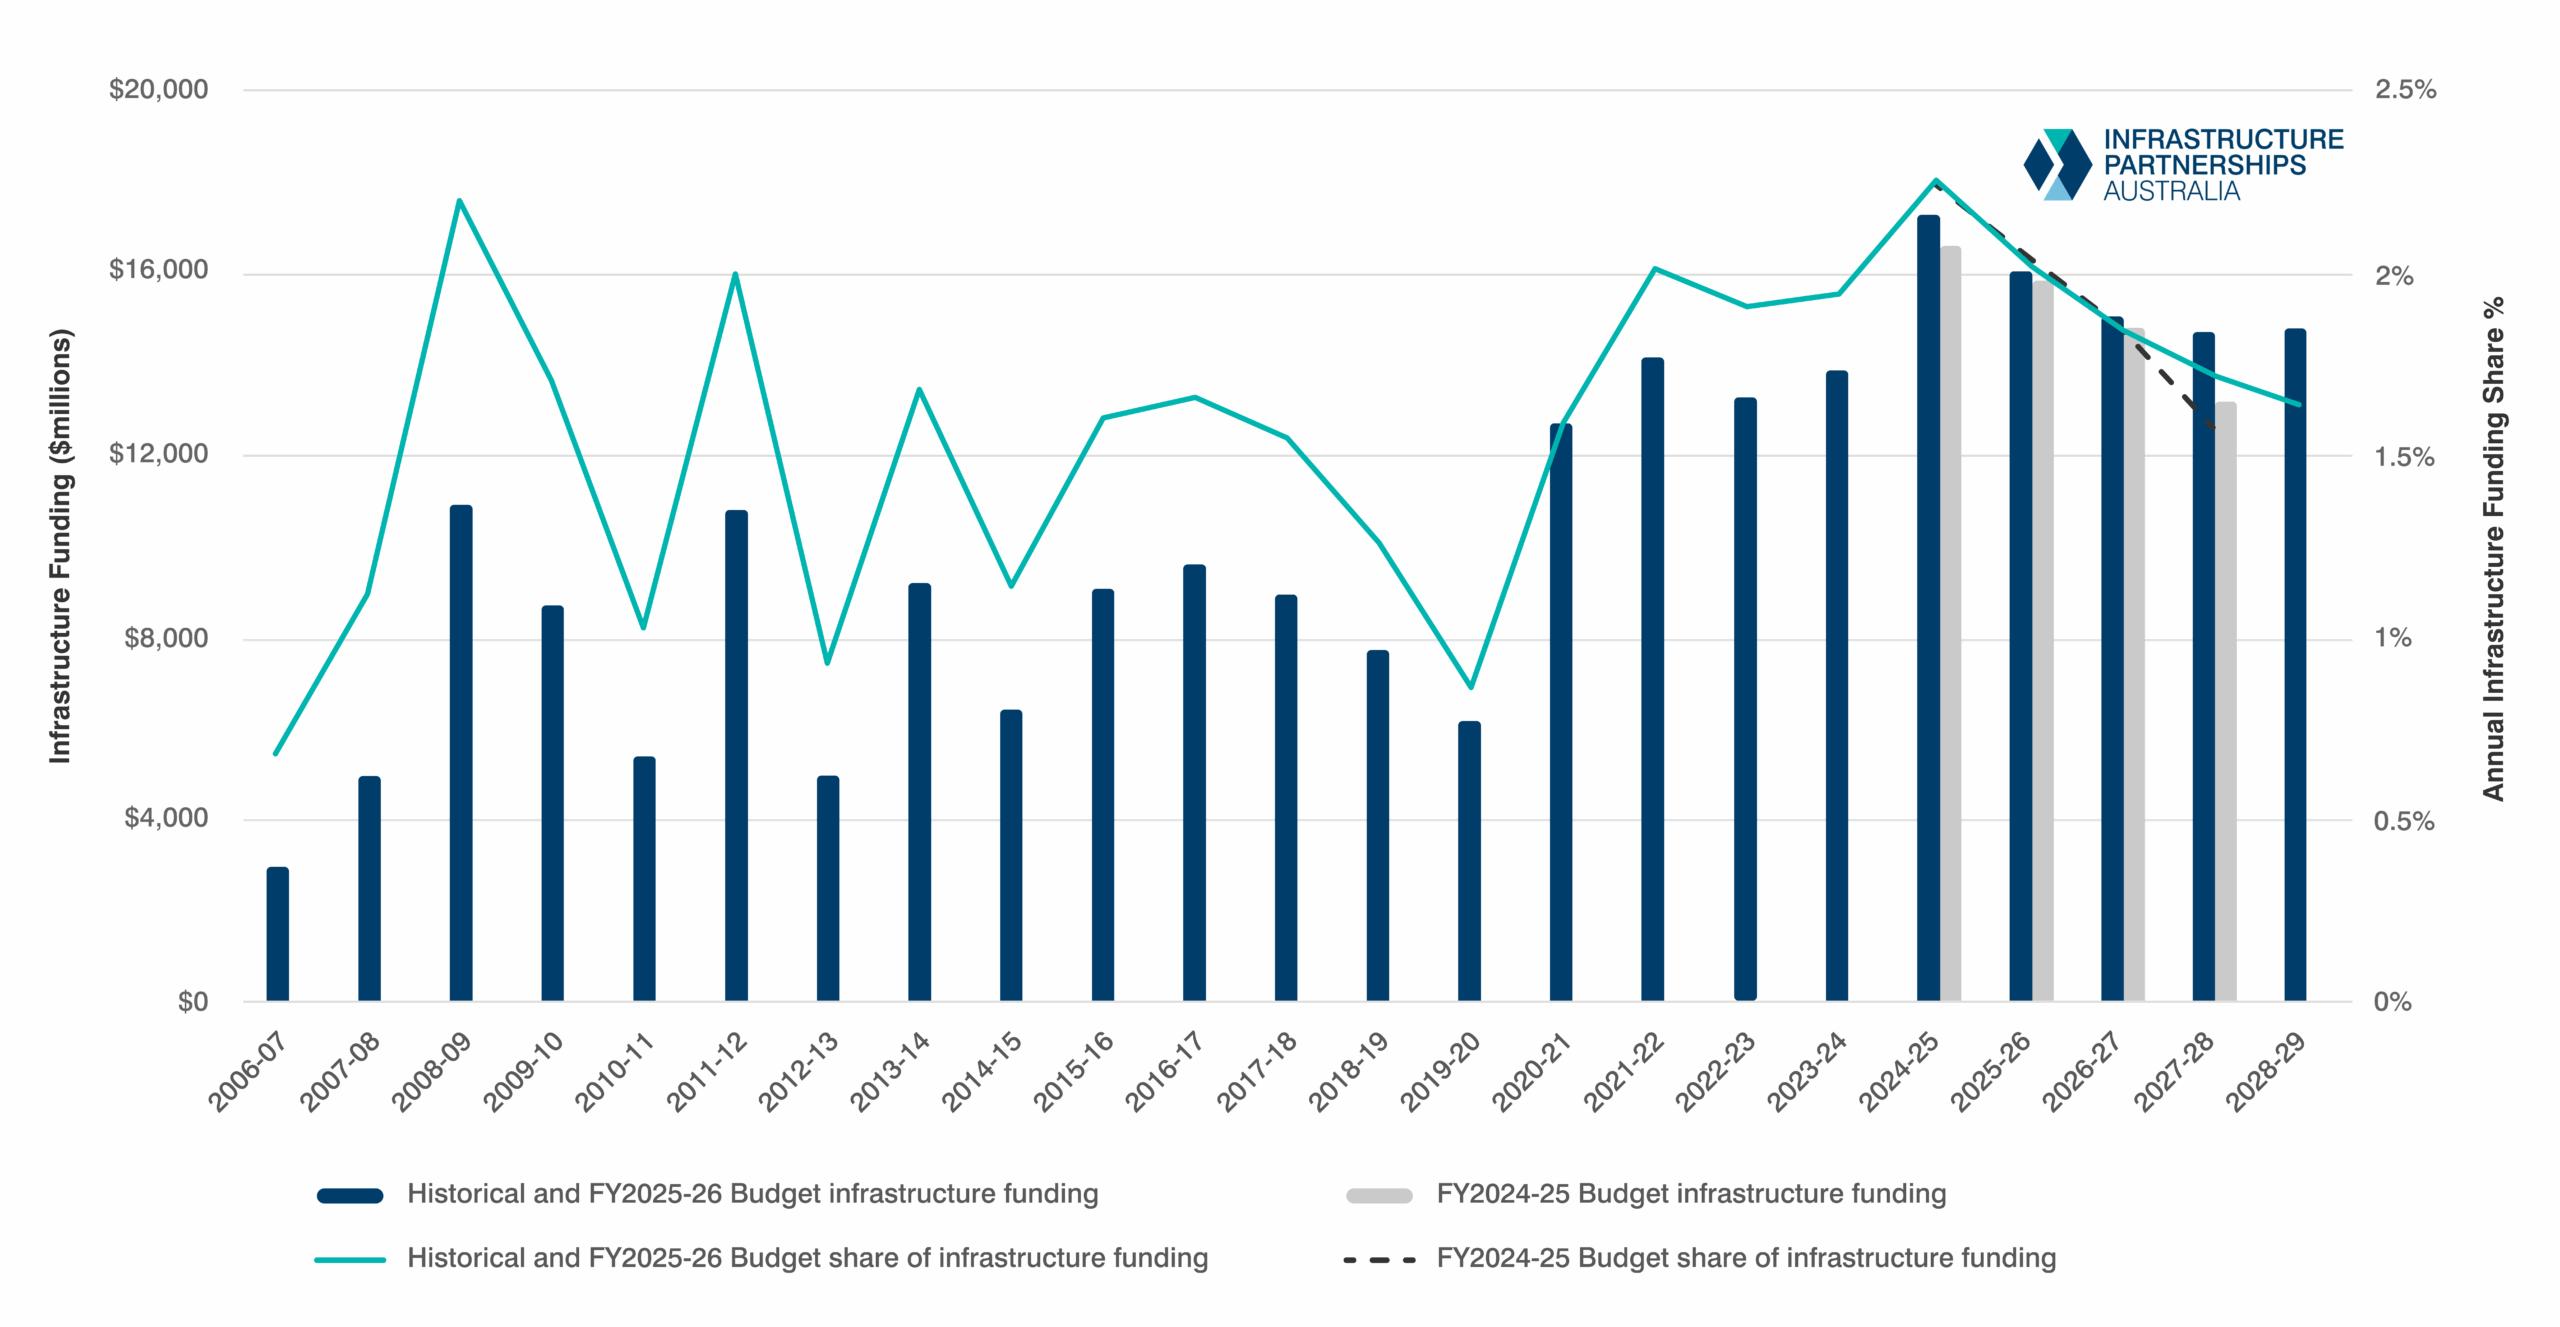
The 2025-26 Federal Budget allocated general government infrastructure funding of $60.7 billion over the four years to FY2028-29, equivalent to a Share measure of 1.8 per cent. This is $118 million more than last year’s Budget and represents a real decline of $493 million.
The 2025-26 Budget’s four-year spend equates to a narrow Spread measure of 0.1 per cent above the long-term trend of 1.7 per cent of general government expenditure.
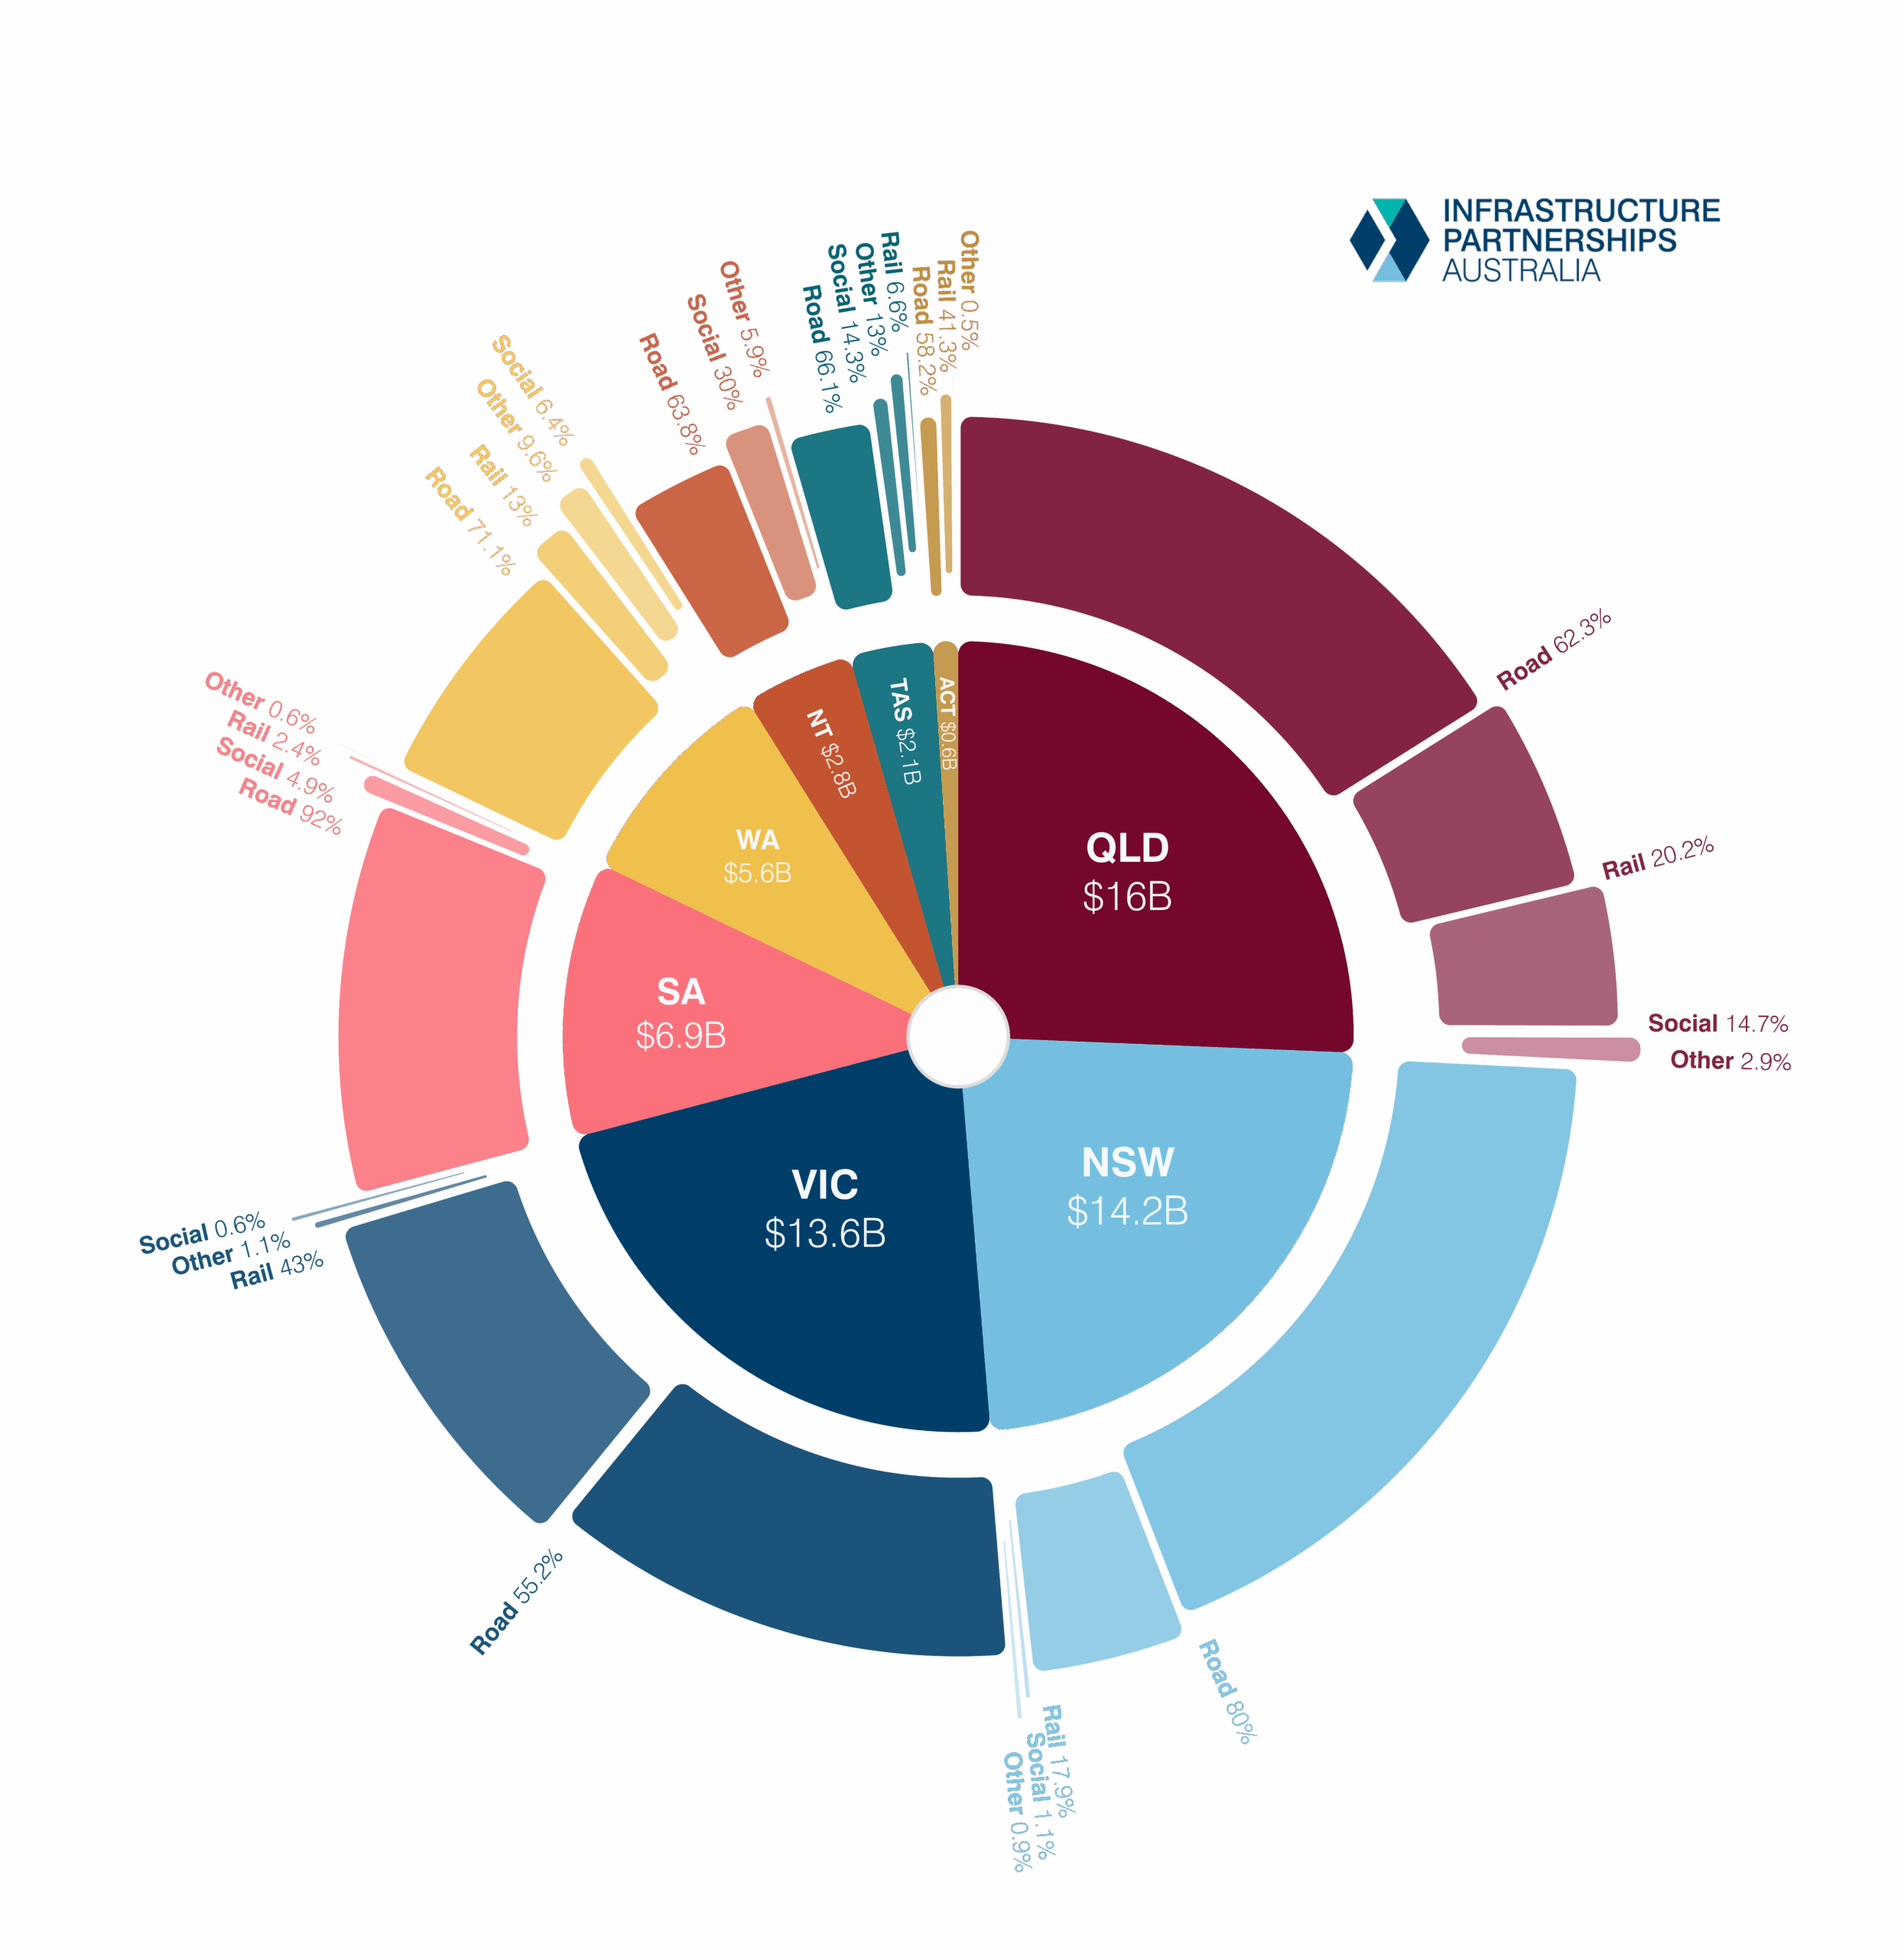
Of the Federal Government’s infrastructure allocations, Queensland will receive the greatest share, with $16 billion allocated over the next four years, while NSW will receive $14.2 billion and Victoria $13.6 billion.
The breakdown of how funding has been allocated to the states and territories is shown in Figure 2.
Figure 2: Federal Budget infrastructure allocations by jurisdiction and asset class
Source: Infrastructure Partnerships Australia analysis of the 2025-26 Federal Budget
Australian Capital Territory
Source: Infrastructure Partnerships Australia analysis of the 2025-26 Australian Capital Territory Budget
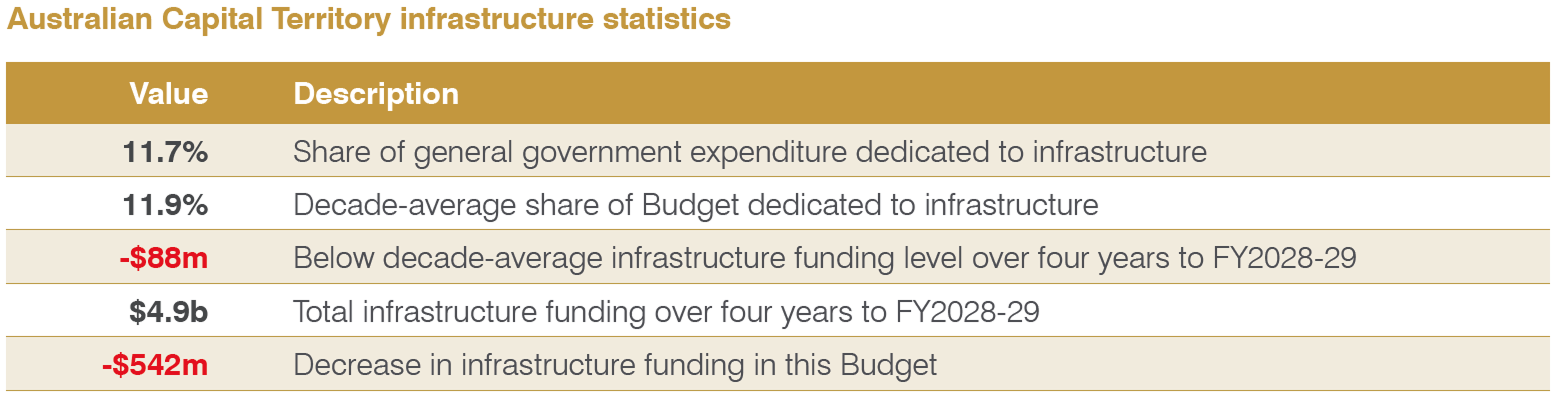
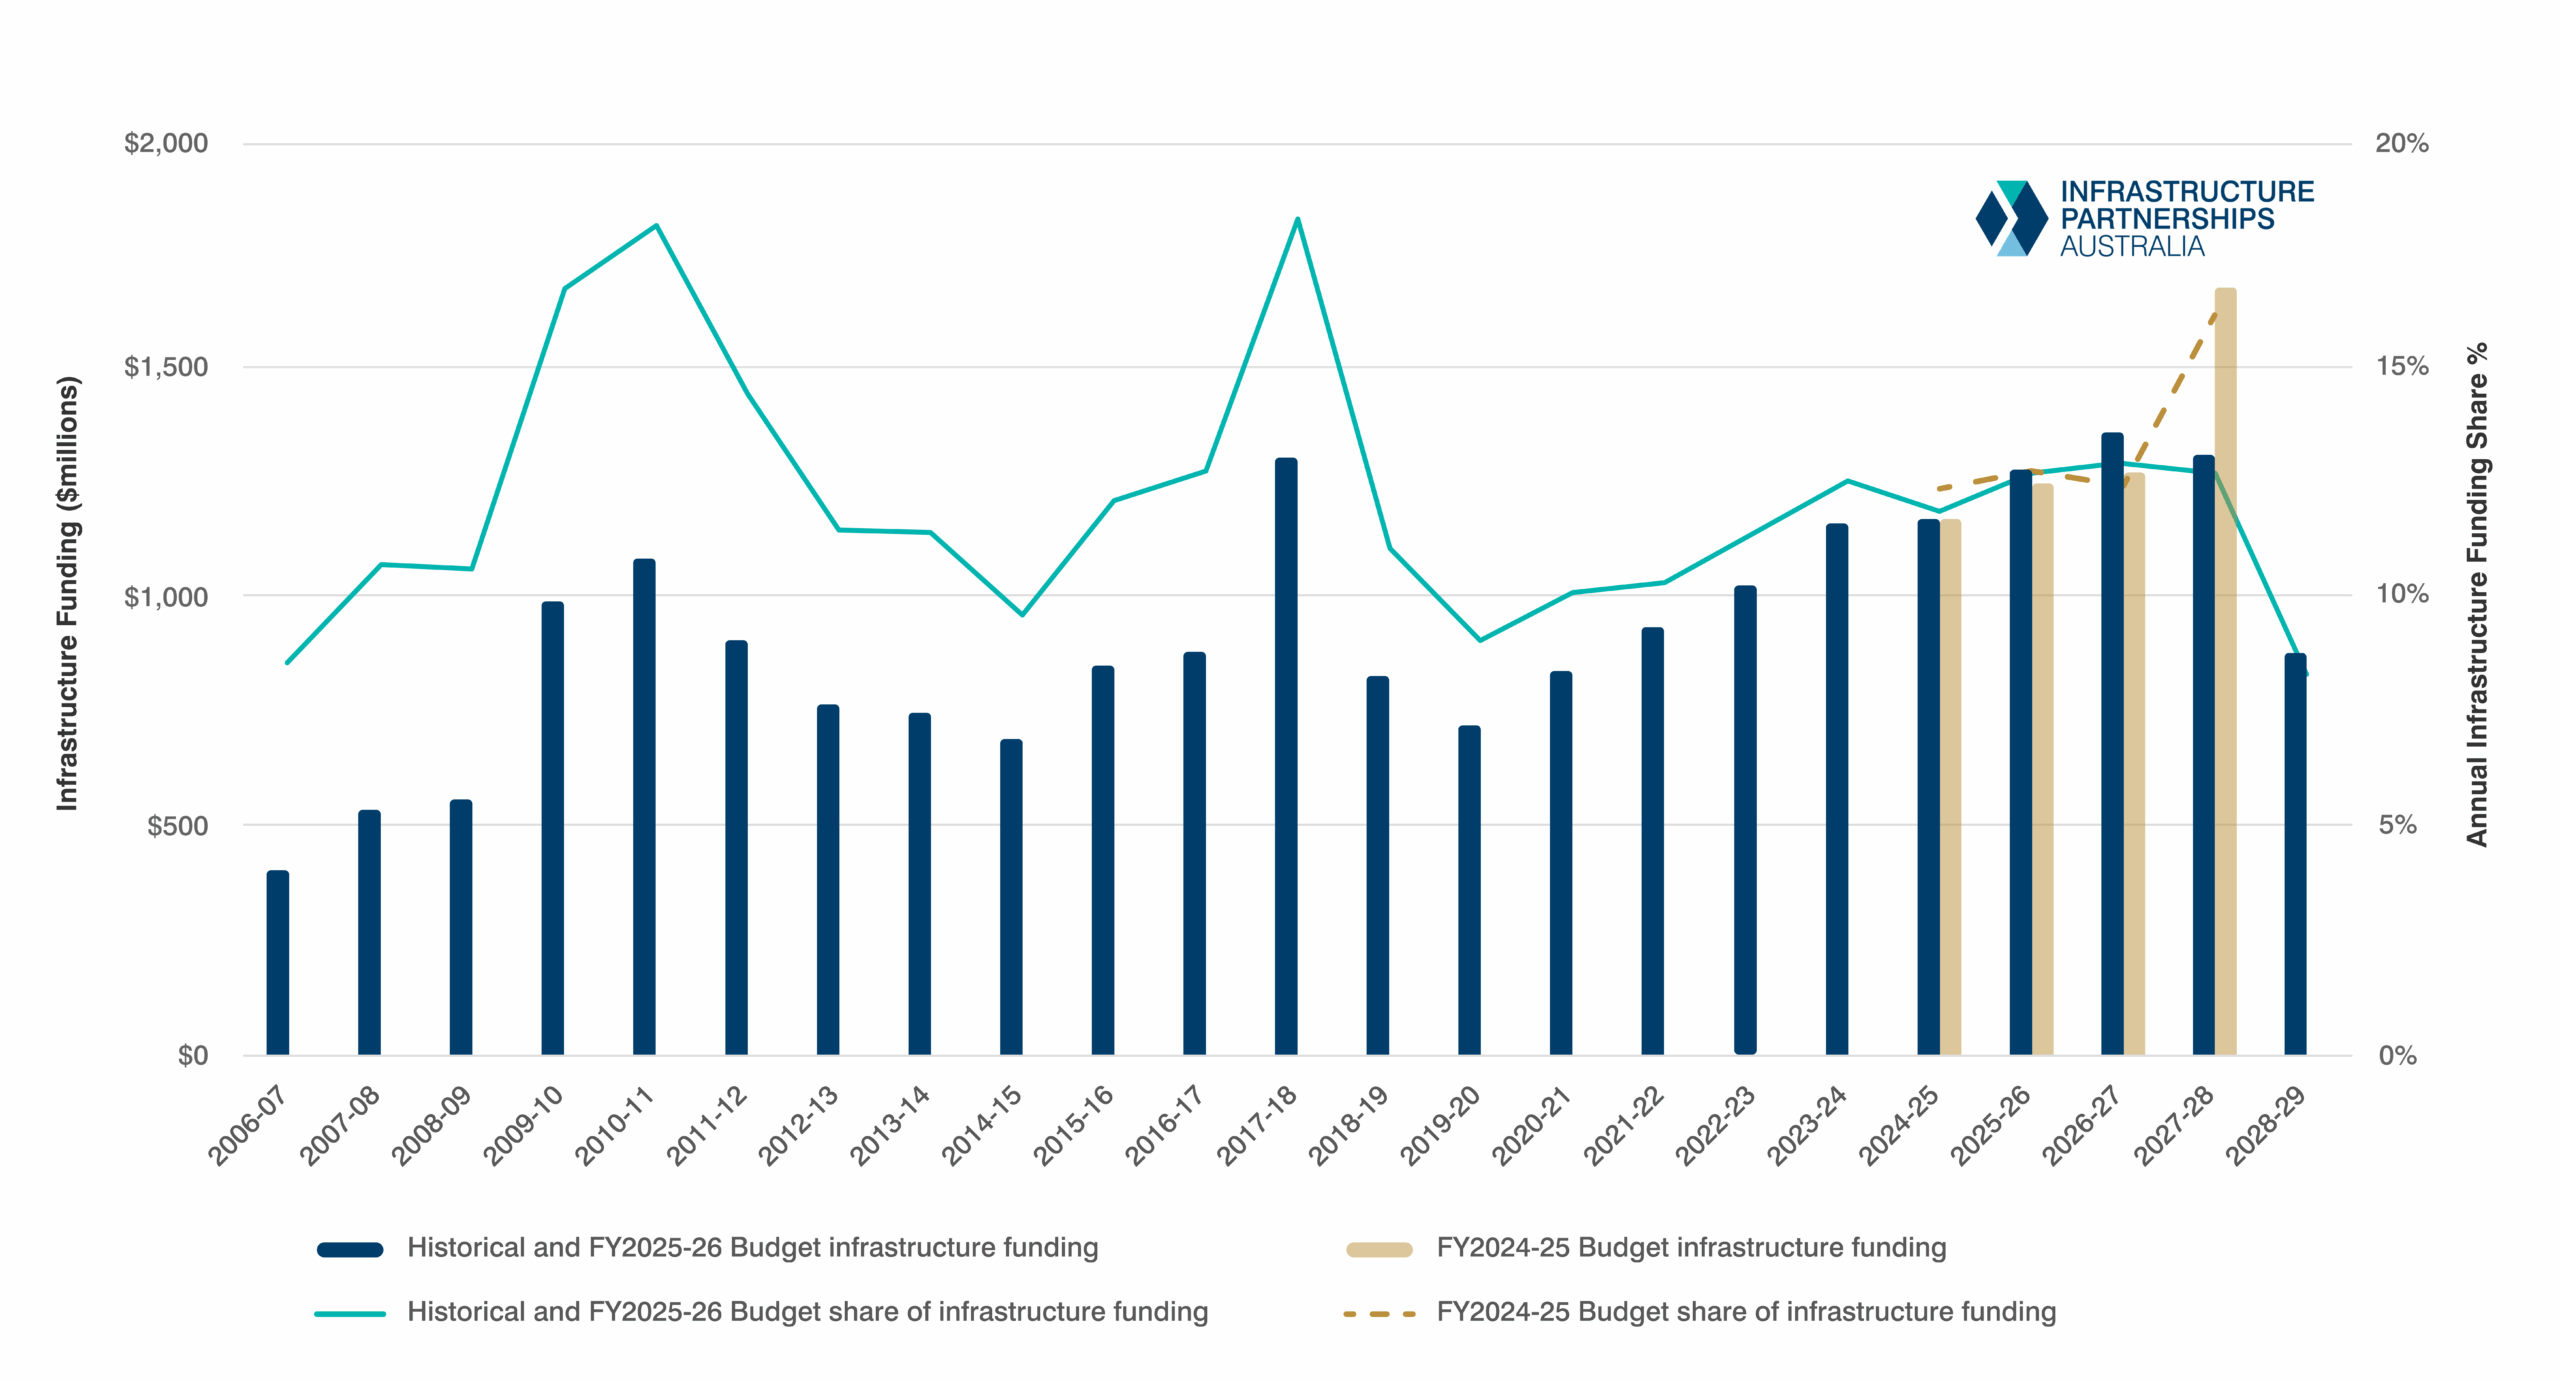
Overall infrastructure funding in the ACT remains steady this year, with an infrastructure allocation of 11.7 per cent of general government expenditure. The ACT’s stable approach sees a contractionary Spread measurement of just -0.21 per cent.
This Budget moved funding for the ACT Light Rail Stage Two out of the forward estimates period – a further delay after last year’s Budget expected most funding to hit the balance sheet in FY2027-28. This minimum two-year delay for the Territory’s biggest project has seen per capita funding in the state slide down 9.5 per cent from $11,400 to $10,300.
Despite these variations in the forward estimates, the ACT’s infrastructure allocation to FY2028-29 is skewed by only 5.9 per cent compared to the previous four years of expenditure.
Northern Territory
Source: Infrastructure Partnerships Australia analysis of the 2025-26 Northern Territory Budget
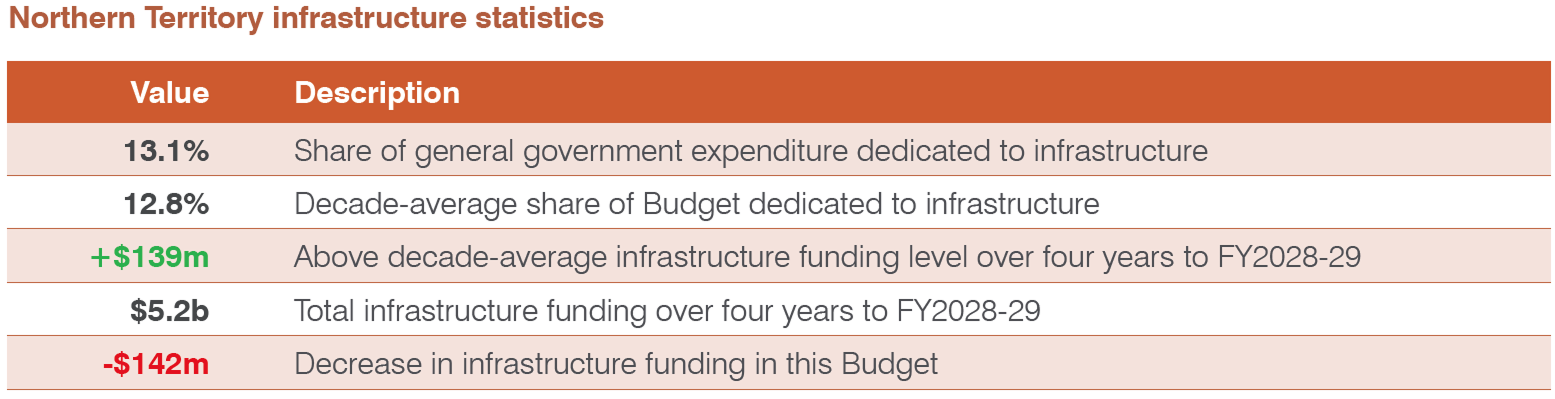
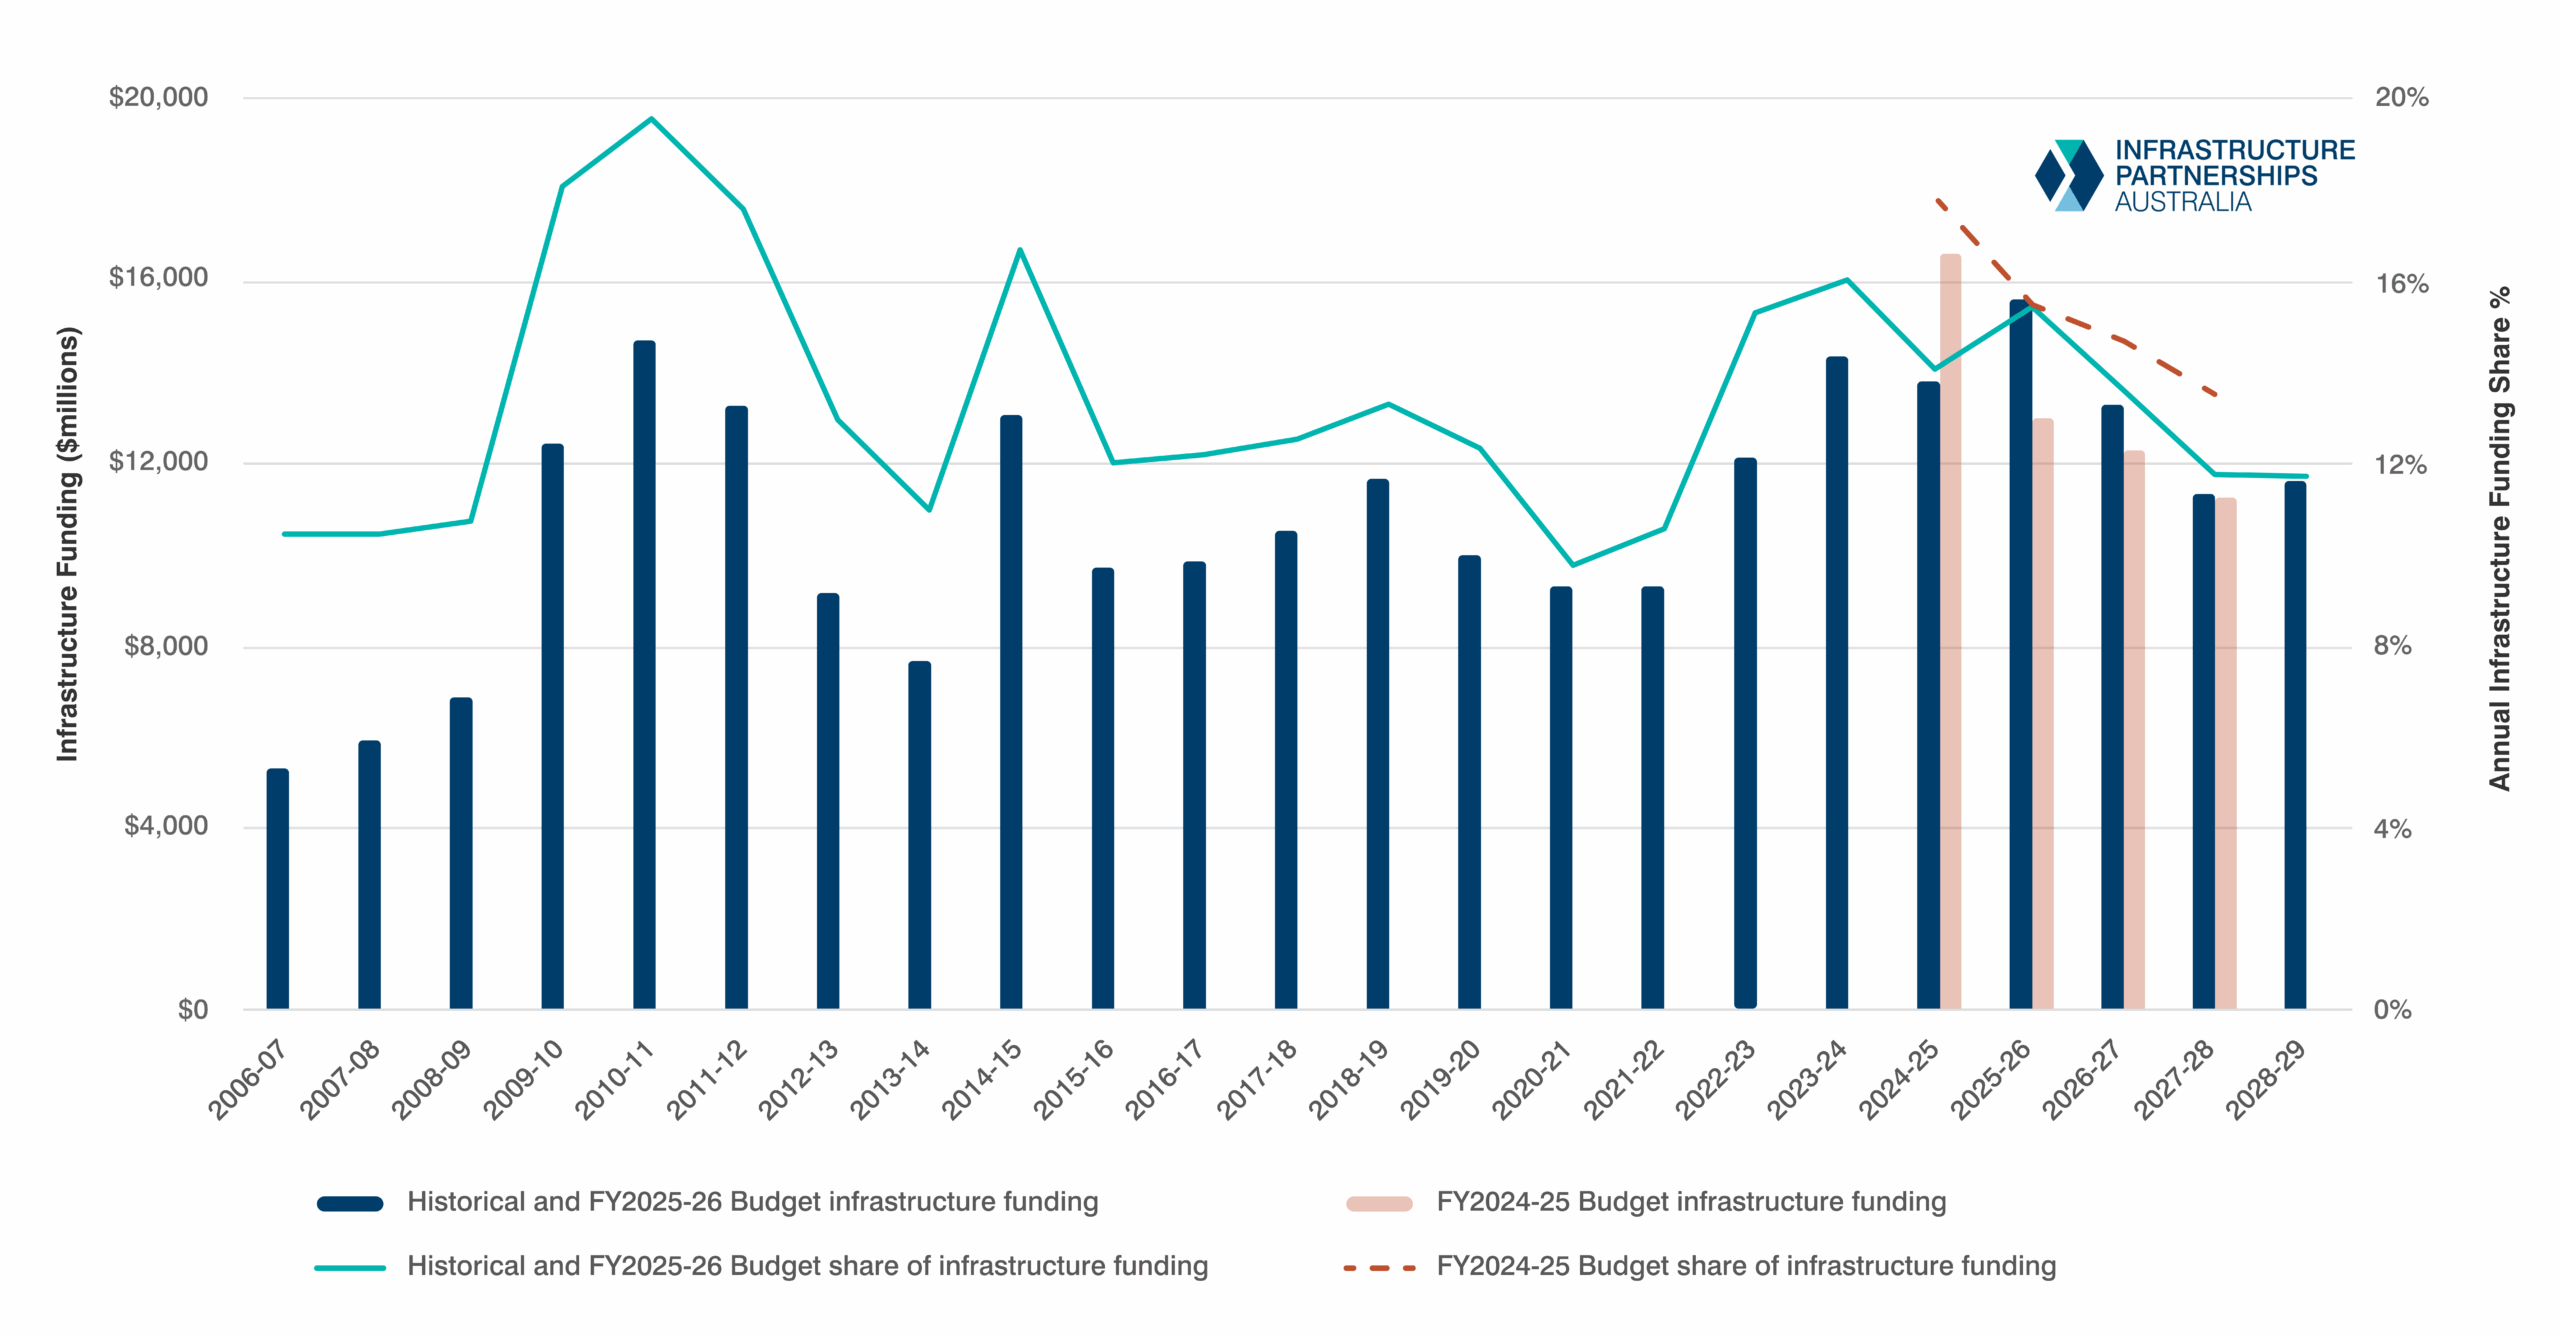
The Northern Territory’s infrastructure profile is benefited by a small, dispersed population that requires consistent levels of infrastructure funding and few large and distortionary investments. The 2025-26 Budget four-year allocation to infrastructure is skewed by just 2.1 per cent to the forecast budget period.
This steady profile has led to a Spread between infrastructure funding for the four years to FY2028-29 of just 0.35 per cent higher than the previous decade.
The Northern Territory has the highest per capita funding of any jurisdiction in Australia at $20,200 per person. This is 1.8 per cent lower than last year’s allocation of $20,600 per person.
Related Content
Australian Infrastructure Budget Monitor 2026-27
Infrastructure Partnerships Australia’s Australian Infrastructure Budget Monitor 2026-27 measures infrastructure funding commitments by jurisdictions for the current Budget year and forward estimates (FY2026-27 to FY2029-30).

Budget Hub 2026
Find all you need to know about the latest Budget papers from Federal, State and Territory Governments. We provide insights into their infrastructure investment programs beyond the headline figures.
Budget Hub 2025
Find all you need to know about the latest Budget papers from Federal, State and Territory Governments. We provide insights into their infrastructure investment programs beyond the headline figures.
Australian Infrastructure Budget Monitor 2024-25
Infrastructure Partnerships Australia’s Australian Infrastructure Budget Monitor 2024-25 (Budget Monitor) measures infrastructure funding commitments by jurisdictions for the current Budget year and forward estimates (being FY2024-25 to ...
Budget Hub 2024
Find all you need to know about the latest Budget papers from Federal, State and Territory Governments. We provide insights into their infrastructure investment programs beyond the headline figures.
Australian Infrastructure Budget Monitor 2023-24
Infrastructure Partnerships Australia’s Australian Infrastructure Budget Monitor 2023-24 (Budget Monitor) measures infrastructure funding commitments by jurisdictions for the current Budget year and forward estimates (being FY2023-24 to ...
Budget Hub 2023
Find all you need to know about the latest Budget papers from Federal, State and Territory Governments. We provide insights into their infrastructure investment programs beyond the headline figures.
Australian Infrastructure Budget Monitor 2022-23
The 2022-23 Budgets delivered by Australia's Federal, State and Territory Governments increase infrastructure expenditure once again.
Budget Hub 2022
Find all you need to know aboout the latest Budget papers from Federal, State and Territory Governments. We provide insights into their infrastructure investment programs beyond the headline figures.
Contact Information
Adrian Dwyer
Chief Executive Officer
Jack Bateman
Head of Data and Analytics
Boronia Morison
Head of External Affairs
Sign up for more Infrastructure Analysis
Sign up for our popular weekly Infrastructure Report newsletter and keep up to date on all the latest developments in the sector.
Sign Up