
Australian Infrastructure Budget Monitor 2023-24
Infrastructure Partnerships Australia’s Australian Infrastructure Budget Monitor 2023-24 (Budget Monitor) measures infrastructure funding commitments by jurisdictions for the current Budget year and forward estimates (being FY2023-24 to FY2026-27). This report collates information from the latest Budget papers from Federal, state and territory governments to provide insights into their infrastructure investment programs beyond the headline figures.
Message from the CEO
The 2023-24 Budget Season saw Australia’s state and territory governments outline their fiscal plans for the next four years amidst a number of infrastructure reviews, persistent inflation and surging growth.
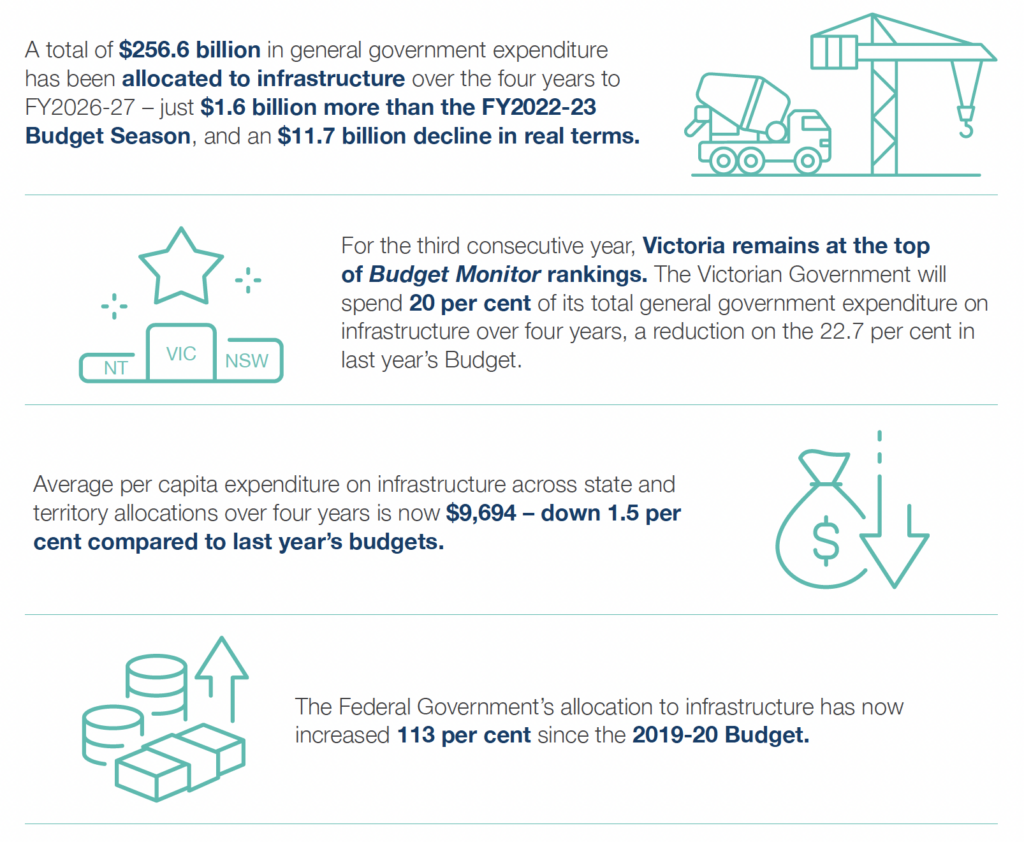
Overall, infrastructure expenditure grew marginally this year with $256.6 billion in general government expenditure allocated to infrastructure across all states and territories over the four years to FY 2026-27. This is $1.6 billion more than the FY2022-23 Budget Season, however in real terms equates to an $11.7 billion decline. This moderation in spend is compounded when compared to the $100 billion increase recorded in total general government expenditure, bringing infrastructure’s share of total budget funding down by 2.7 percentage points.
Victoria takes the top spot in Budget Monitor rankings for the third year running, allocating $78.5 billion to infrastructure over four years, constituting 20 per cent of its total general government expenditure. Despite a $6.7 billion decrease on its FY2022-23 allocation, Victoria remains above New South Wales, who took second place with $85.6 billion infrastructure spend representing 16.6 per cent of its general government expenditure.
Against the backdrop of the Federal Infrastructure Investment Program Strategic Review – announced eight days before the Federal Budget was handed down – this year’s state and territory budgets all trod a similar path of maintaining existing pipelines and steering away from new project announcements. The maintenance of existing large-scale pipelines has been a core budget theme for several years, with the ramping up of activity in existing large programs accounting for most of the growth in overall expenditure.
This year’s steady allocation reflects a market tracking along at capacity. Skills and resource constraints have continued to challenge delivery teams, and governments have been hesitant to add to this pressure. However, as large-scale programs near completion and Australia continues to beat its population forecasts, governments should soon turn their focus to new projects to ensure a growing nation can travel on efficient road and rail networks and access quality health and education services.
The 2023-24 Budget Season also saw several governments seek to reintroduce themselves into energy markets. These new interventions are headlined by the establishment of the State Energy Corporation in Victoria, the Energy Security Corporation in NSW, Queensland Hydro, and the allocation of general government expenditure to energy generation projects in Western Australia. Governments becoming increasingly awake to the role required of them to shepherd the economy through the energy transition is undoubtedly a good outcome. However, they should ensure they prioritise having the right market settings in place before they risk crowding out private capital by making project level interventions.
We hope you find the 2023-24 Australian Infrastructure Budget Monitor useful. If you are interested in learning more about the infrastructure pipeline in Australia, you can find more information on our Australia and New Zealand Infrastructure Pipeline (ANZIP) and subscribe to our monthly Pipeline Reports. Further detailed analysis of each jurisdiction’s Budget is available exclusively for Infrastructure Partnerships Australia members.
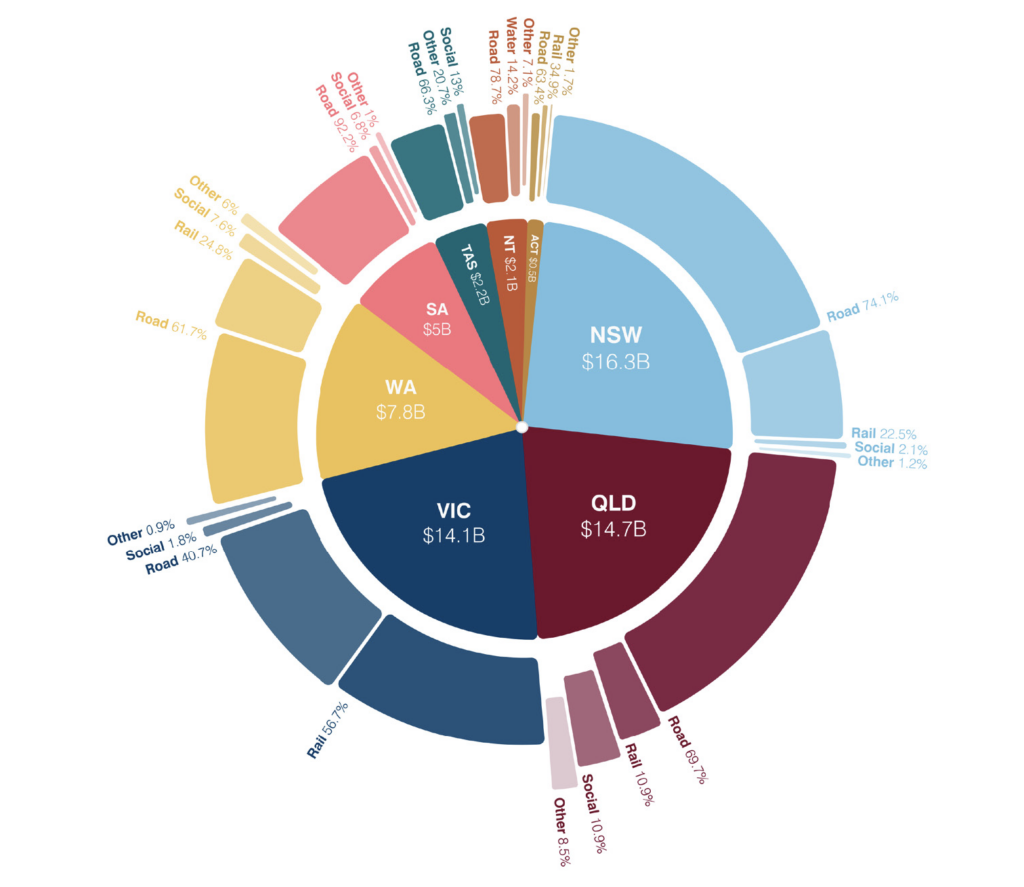
Figure 1: 2023-24 Australian infrastructure funding levels, ranked by share of budget expenditure

Key Insights
Infrastructure wave slows following several years of consistent increases to infrastructure spend
By allocating $256.6 billion of general government expenditure over the four years to FY2025-26, this year’s budgets have surpassed last year’s infrastructure spend of $254.8 billion by 0.7 per cent, or in real terms, an $11.7 billion decline. This decreased expenditure becomes more stark when considering rising construction and debt costs. While the market may be operating at capacity, the need for sustained infrastructure investment remains as the country experiences a high population growth rate – 1.4 per cent average growth over the last 10 years and well above the projected rate of other OECD countries – expected to grow 0.2 per cent over the next 30 years.
While not included in the rankings, the Federal Government has kept its infrastructure funding fairly steady, allocating $62.8 billion in general government expenditure to infrastructure projects. This is an increase of two percent from last year’s October Budget, mirroring the increase between the 2021-22 and 2022- 23 Budgets.
While not included in the rankings, the Federal Government has kept its infrastructure funding fairly steady, allocating $62.8 billion in general government expenditure to infrastructure projects. This is an increase of two percent from last year’s October Budget, mirroring the increase between the 2021-22 and 2022- 23 Budgets.
Figure 2: Federal Budget infrastructure allocations by jurisdiction and asset class
Jurisdiction rankings
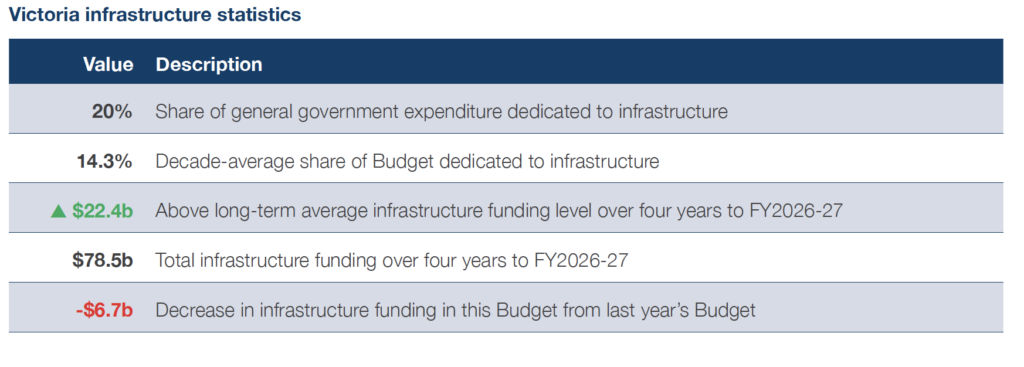
After taking top spot last year for the second time, Victoria has once again finished in first place in the Budget Monitor rankings with a $78.5 billion allocation to infrastructure to FY2026-27– representing 20 per cent of the State’s total general government expenditure. Victoria defends its position in top spot despite a decline in expenditure and a slight reduction of allocated infrastructure spend as a percentage of general government expenditure from 23.1 per cent in last year’s Budget.
New South Wales takes second place allocating $85.6 billion in general government expenditure to infrastructure over four years. While this is a three per cent decrease on the planned expenditure in last year’s Budget, it is slightly above the 10-year average of 15.9 per cent for total general government spending at 16.6 per cent.
After trading places last year, South Australia and the Northern Territory have swapped back in this year’s rankings, with the Northern Territory moving into third place after increasing its four-year share of total spending on infrastructure to 15.4 per cent. South Australia has taken fourth place, despite increasing its share from 14.3 per cent to 14.8 per cent.
The Australian Capital Territory rises one place to fifth with a 13.6 per cent allocation to infrastructure.
While only moving up one place, Queensland’s sixth place represents the greatest shift in this year’s rankings. After perennially occupying seventh place, the Government has for the second year in a row provided the greatest increase of any jurisdiction, with successive 19 and 21 per cent increases in expenditure. The State’s four-year allocation for infrastructure now stands at $45.3 billion, an increase of $13.4 billion over the last two years. While additional spend is always a welcome change, the Queensland Government will have to carefully examine the sequencing of its pipeline to ensure there is capacity available in the market to deliver this increase.
Tasmania falls one spot to seventh place with an 11.6 per cent allocation to infrastructure, down from 13.5 per cent last year.
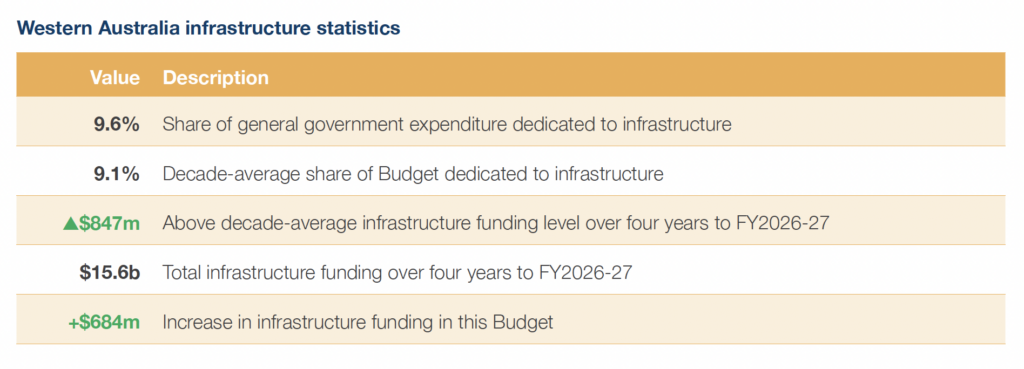
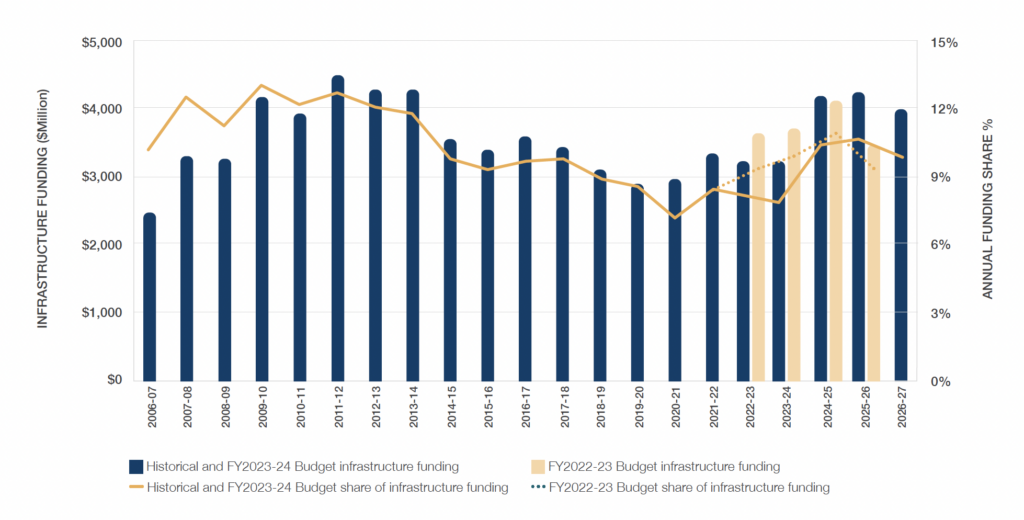
The Western Australian Budget delivered an infrastructure funding share of 9.6 per cent – 0.3 percentage points less than last year, but above the 10-year average of 9.1 per cent. The State remains in last place in the rankings for proportion of general government expenditure allocated to infrastructure for the seventh consecutive year.
Per capita infrastructure spend analysis
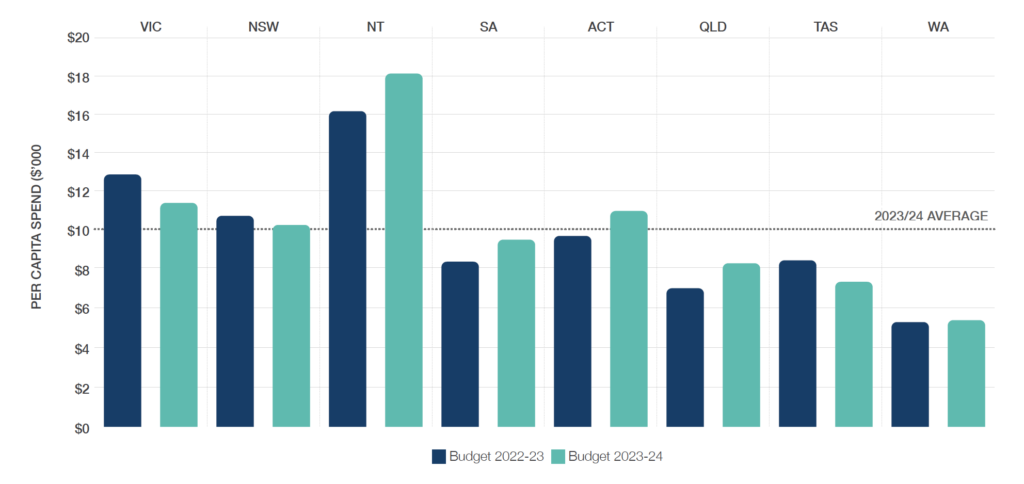
This year’s Budget season sees positive results for per capita infrastructure spend, with five jurisdictions delivering increases. Queensland, South Australia, and the ACT all increased per capita infrastructure spend by over $1,000. The Northern Territory, defined by its dispersed population and large geography, increased per capita spending by $1,910 (12 per cent) to $18,125 per person. Conversely, Western Australia – with a population concentrated in hubs and connected by regional road and rail networks with significant private sector support – saw per capita infrastructure spend slightly increase to $5,500 per person. This remains almost half the national average.
Despite New South Wales and Victoria decreasing their per capita infrastructure spend, both sit higher than the average, coming in at $10,300 and $11,600 respectively. New South Wales delivered a minor decrease of $600 per capita, while Victoria has seen a $1,300 per capita decrease after a historic $3,000 increase delivered in the 2022-23 Budget. Figure 3 shows per capita infrastructure investment across Australia over the last two years.
1st Place: Victoria
Victoria sits atop the Budget Monitor rankings for the third year running
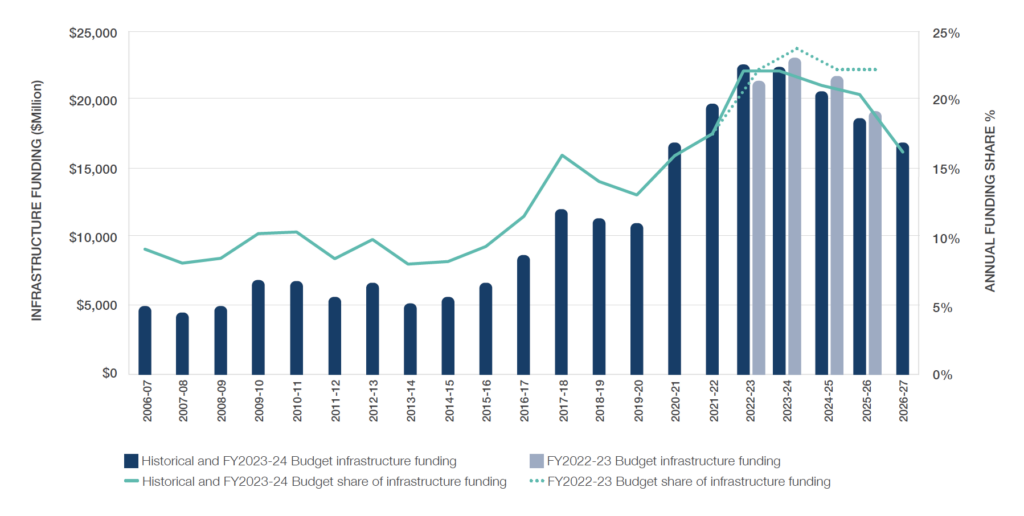
The 2023-24 Victorian Budget sees a continuation of Victoria’s investment in a major pipeline of projects, with an $78.5 billion four-year allocation to general government infrastructure expenditure. This represents approximately $1.6 billion per month for infrastructure spend and equates to 20 per cent of general government expenditure.
Acknowledging the challenges of a heated infrastructure market and tightening fiscal settings, Victoria’s four-year infrastructure allocation is a $6.7 billion reduction in infrastructure funding from last year’s Budget. This slight moderation in infrastructure spend is unsurprising given the high watermark in spending allocated by the State over recent years. Despite this, Victoria remains atop the Budget Monitor rankings after overtaking NSW for the first time in FY2021-2022.
Federal Government’s Infrastructure Review stirs transport uncertainty with only a handful of new rail commitments
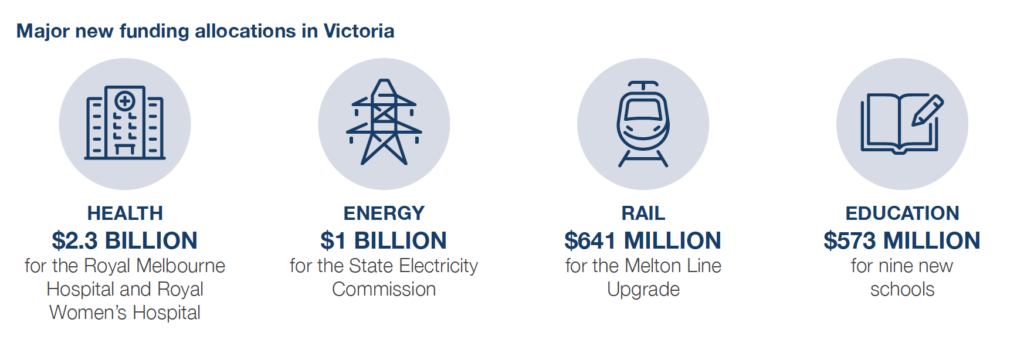
The Federal Government’s review of its Infrastructure Investment Program, meant the Victorian Budget saw only a few new major commitments in rail and no new commitments for major road projects. New rail funding is headlined by the $641 million Melton Line upgrade, to be complete by 2029, $601 million for additional Vlocity Trains, $366 million for the Kananook Train Maintenance Facility Stage Two, and $297 million for the South Dynon Train Maintenance Facility Stage Two. The Budget also confirms an additional $6.5 billion for the Level Crossing Removal Project, as announced in the 2022 Victorian Economic and Fiscal Update.
In road, the majority of funding flows to previously announced projects or those already under delivery, including $2.1 billion in FY2023-24 for the North East Link – Primary Package (Tunnels), $1.7 billion in FY2023- 24 for the Melbourne Metro Tunnel project, and $1.2 billion in FY2023-24 to the West Gate Tunnel.
Social infrastructure takes centre stage, with new hospitals and expanded education infrastructure
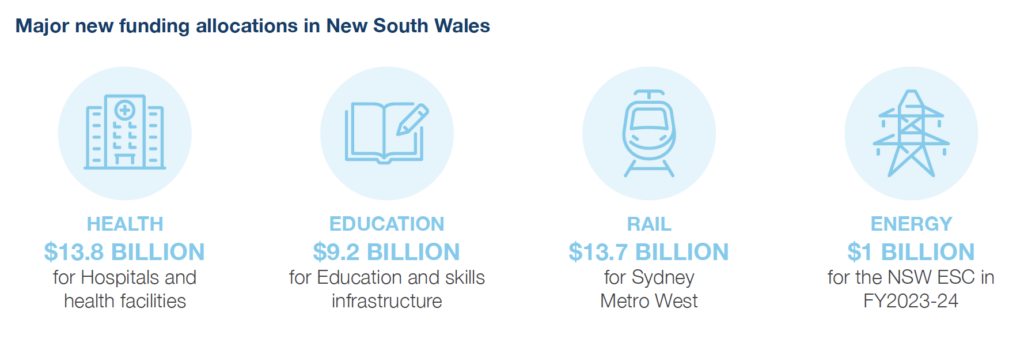
This year’s Budget commits $3 billion for new and upgraded health infrastructure including $251 million in FY2023-24, however, some of this funding lies outside the forward estimates. Headlining this commitment is a $2.3 billion allocation to redevelop the Royal Melbourne Hospital and Royal Women’s Hospital over eight years, with $75 million allocated in FY2023-24. An additional $320 million is allocated to a new Hospital Infrastructure Delivery Fund to undertake design and planning works for seven new and upgraded hospitals, to be included in future budgets.
The Budget allocates $3.8 billion in new funding for education and skills infrastructure – a $2.2 billion increase on last year – including $573 million over the next three years to deliver nine new schools, and a further $208 million over the next five years to deliver new kindergarten facilities on government schools’ sites.
The State Electricity Commission returns
The Budget confirms the Victorian Government’s election commitments to re-establish the State Electricity Commission (SEC) through a $1 billion equity investment comprising a $600 million contribution in FY2023-24 and $400 million in FY2024-25. With the stated objective to ‘accelerate investment in renewable energy’ the SEC’s Pioneer investment mandate states it will attempt to be an active energy market participant’.
2nd Place: New South Wales
Despite allocating over $80 billion for the fifth consecutive budget, a reduction in infrastructure spend begins
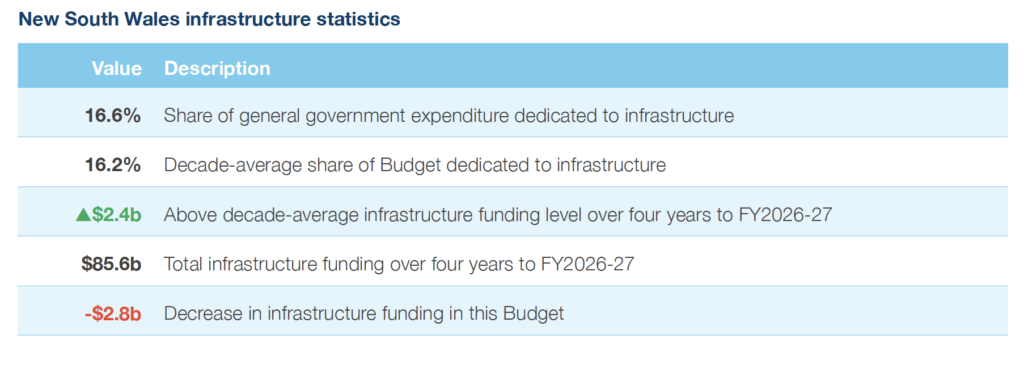
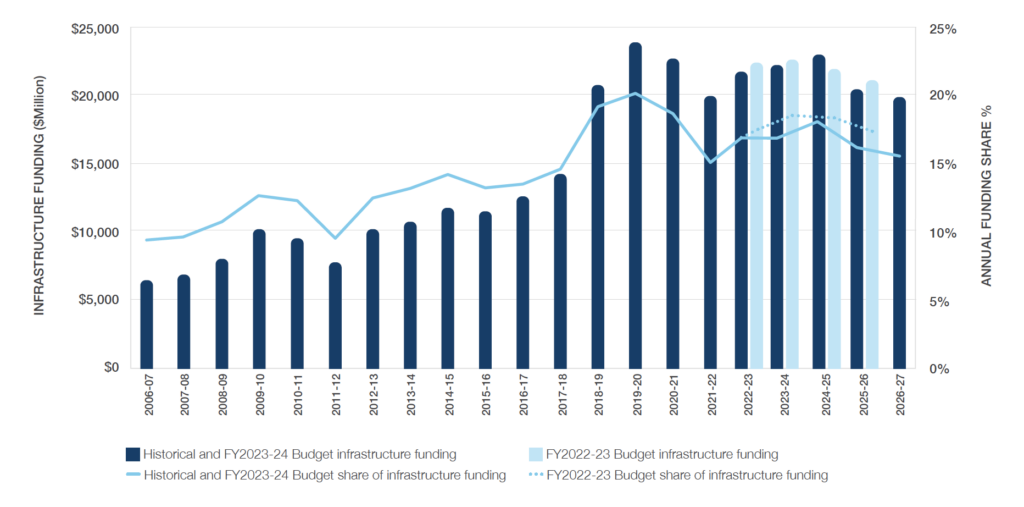
The NSW Budget allocates $85.6 billion general government infrastructure funding over the four years to FY2026-27. This is a $2.8 billion, or three per cent, decrease on the planned outlay in last year’s NSW Budget and is the first decrease in spending registered in the State by the Budget Monitor since it began publication in 2018. At 16.6 per cent of total general government spending, the Government’s allocation remains slightly above the 10-year average of 15.9 per cent. This expenditure marks the fifth consecutive budget with a four-year allocation to infrastructure above $80 billion.
The 2023-24 Budget signals an intention from the NSW Government to reduce infrastructure expenditure toward two per cent of Gross State Product (GSP) by FY2026-27, and to maintain this level beyond the forward estimates period. The Government has indicated that it aims to align infrastructure capital expenditure with depreciation alongside additional investment to meet population and economic growth. This will see expenditure fall from a high of 3.3 per cent of GSP in FY2019-20 and 2.8 per cent this financial year.
Sydney Metro and Strategic Infrastructure Reviews impact infrastructure spend, while state moderates new project allocations
Following the release of the Sydney Metro Interim Review a month prior to the Budget being handed down, the Budget allocated an additional $1 billion to the Sydney Metro – City and Southwest line and $39 million to the Western Sydney Airport – Stage Two business case – both key recommendations of the interim review. With a total allocated spending of $24.9 billion over the four years to FY2026-27, Sydney Metro continues to comprise over a quarter of the state’s total four-year infrastructure spend.
The Budget also included the results of the Independent Strategic Infrastructure Review led by Ken Kanofski. The review findings recommended that the Great Western Highway Duplication, the Fast Rail Program, and the Ultimo Powerhouse Museum be delayed or descoped. The Budget confirmed that these recommendations were accepted in full. The review also confirms the Government’s announcement of the cancellation of the Wyangala Dam Wall Rising and the New Dungowan Dam projects prior to the Budget.
NSW takes more direct path on energy investment
Following the re-establishment of the State Electricity Commission in Victoria, the NSW Government has made a commitment to invest in energy infrastructure, by allocating a $1 billion reservation from the Restart NSW Fund to the establishment of the NSW Energy Security Corporation (ESC) in FY2023-24. The ESC will follow the model of the Clean Energy Finance Corporation (CEFC) and partner with industry to support projects including renewable storage solutions, commercially viable technologies to provide grid stability, and community batteries to maximise the benefits of rooftop solar for households.
The Budget also includes additional investment in the Transmission Acceleration Facility, originally introduced in the 2022-23 Budget to support investment in new transmission infrastructure. The Facility has been allocated $1.2 billion in FY2023-24, with $804 million in new capital expenditure this year to maintain the critical path – and address cost and schedule risks – for the Central-West Orana Renewable Energy Zone (REZ), New England REZ and the Hunter Transmission Project. The Facility has been apportioned $3.5 billion over the forward estimate period out to FY2026-27, and the Facility’s estimated total cost has increased to $4.4 billion, up from an estimated total cost of $2.6 billion specified in last year’s Budget.
3rd Place: Northern Territory
The Northern Territory increases spending and returns to third place
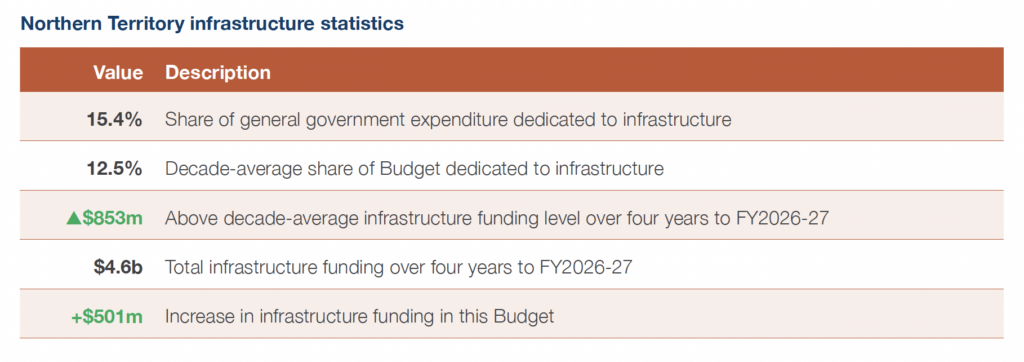
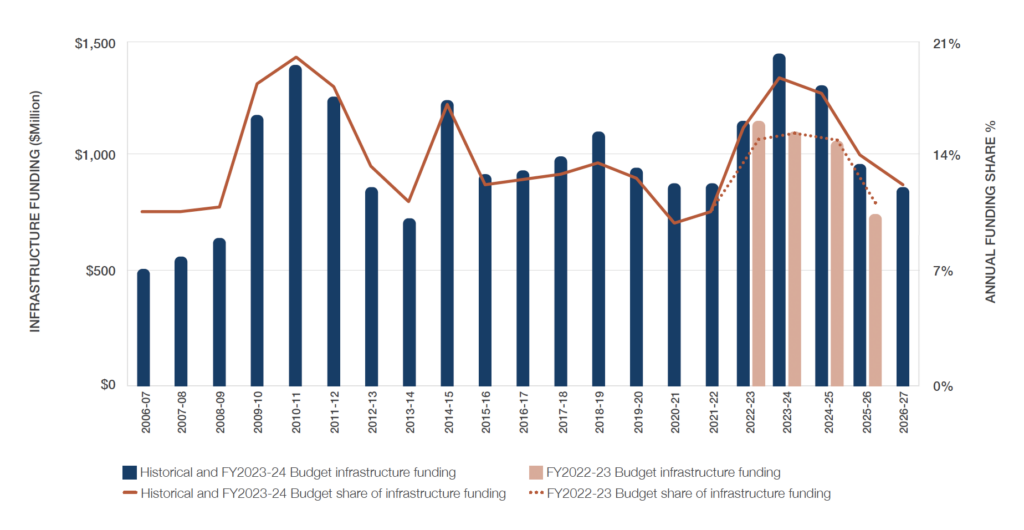
The Northern Territory Government allocated $4.6 billion in general government infrastructure expenditure over the next four years, including $1.4 billion in FY2023-24. The projected spend represents a $501 million increase in forecast expenditure over four years from the 2022-23 NT Budget. The 15.4 per cent share of total government expenditure apportioned for infrastructure over the next four years remains higher than the 10-year average of 12.5 per cent, representing a $853 million boost over the long-term trend. The geographical breakdown of total budgeted infrastructure funding sees approximately 60 per cent allocated to upgrading existing and delivering new regional and remote infrastructure.
Transport allocations headlined by regional and remote road upgrades
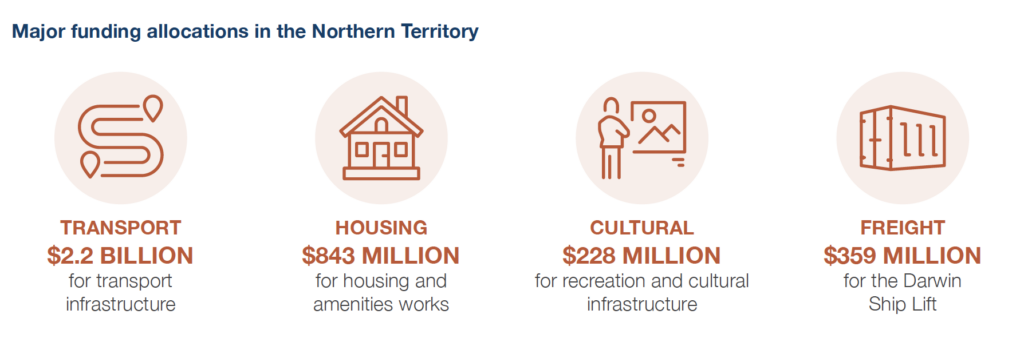
The Budget allocates $2.2 billion to transport infrastructure over the next four years comprising 55 per cent of committed infrastructure expenditure – up from 50 per cent last year. Major transport projects allocated funding in the four-year capital program include $215 million to the upgrading or sealing of gas industry roads, $178 million for the Tanami Road project, $166 million for the Central Arnhem Road upgrades and $114 million for the Buntine Highway upgrade. The Budget also provides $42 million over the next four years to upgrade the Plenty Highway and Tjukaruru Road, as part of the Outback Way Upgrade. The $515 million Darwin Ship Lift Facility sees $359 million allocated over the next four years, including $248 million in additional funding.
Provision of social housing continues in the Northern Territory
The housing and community amenities capital works outlined in the Budget total $843 million over four years, accounting for 21 per cent of total infrastructure funding. This includes $601 million for remote housing across the Territory, including $589 million for the Remote Housing Investment Package, of which $296 million is allocated through HomeBuild NT, Room to Breathe and government employee housing; and $291 million to land servicing to support the Remote Housing Investment Package.
4th Place: South Australia
South Australia falls down Budget Monitor rankings despite continuing to increase year-on year spending
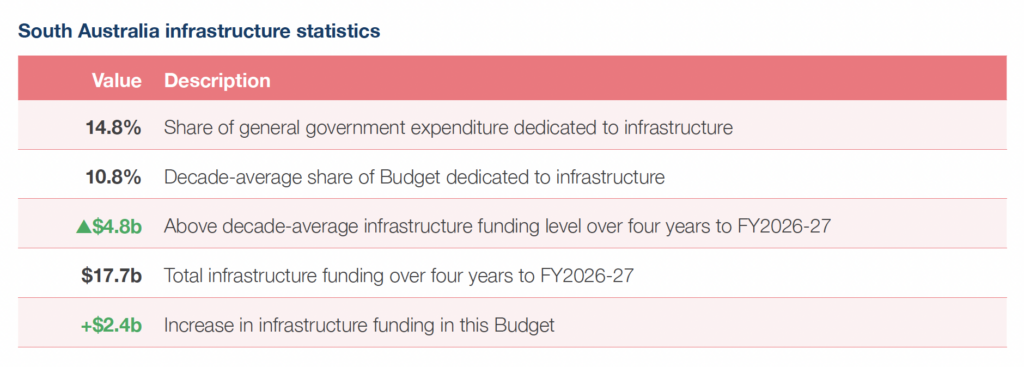
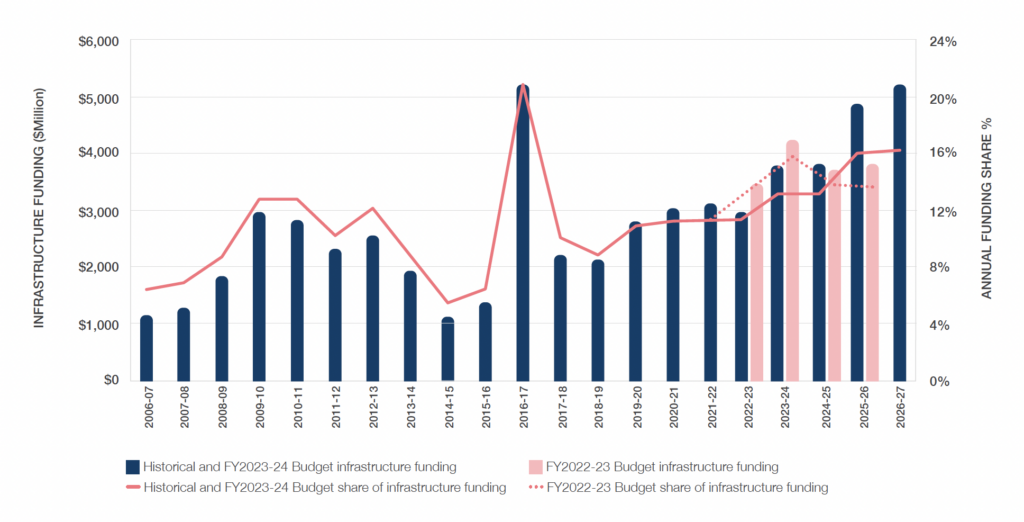
The South Australian Budget contains an infrastructure investment of $17.7 billion, or 14.8 per cent, of general government expenditure over the next four years, including $3.8 billion in FY2023-24. The four-year infrastructure spend represents a $2.4 billion increase on the previous SA Budget. The 14.8 per cent share of total government expenditure for infrastructure over the next four years is significantly higher than the 10-year average of 10.8 per cent. However, the Budget registers an infrastructure underspend of $537 million – or 10 per cent of the total planned spending in FY2022-23.
Budget spending targeted at delivering existing projects across roads, health, and housing infrastructure
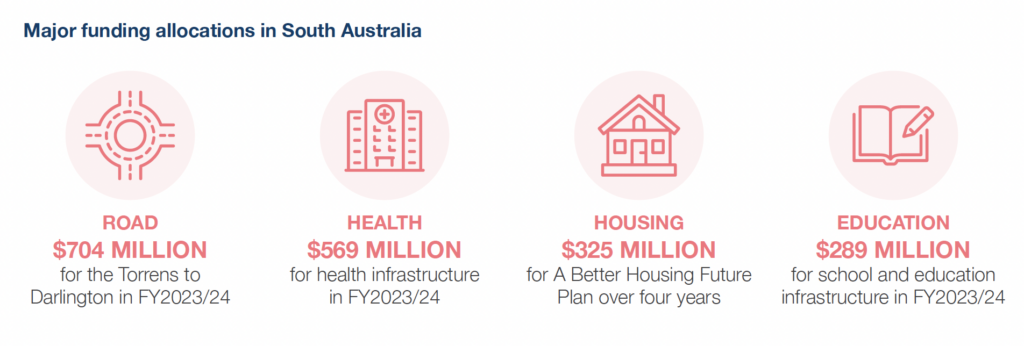
No new major road commitments were made in this year’s Budget, with the North-South Corridor – Torrens to Darlington project continuing to dominate the funding allocated for road projects, including $704 million in this financial year. In addition, $211 million has been allocated in FY2023-24 for the Fleurieu Connections Package, which has seen a cost increase from $560 million to $685 million.
SA Budget supports strong social infrastructure pipeline
The 2023-24 Budget allocates $569 million to health infrastructure in FY2023-24, with the majority of spending allocated to existing projects, including $131 million to The Queen Elizabeth Hospital Redevelopment Stage Three project and $119 million to the New Women’s and Children’s Hospital in FY2023-24.
Allocations to new projects in this Budget are headlined by $24 million to the Noarlunga Hospital Expansion project in FY2023-24. In housing, the Budget allocates $314 million over four years for the ‘A Better Housing Future Plan’ established in February. The Plan aims to deliver 1,200 social and affordable houses and provide additional regional housing supply.
5th Place: Australian Capital Territory
Australian Capital Territory increases infrastructure spending for the fourth year in a row
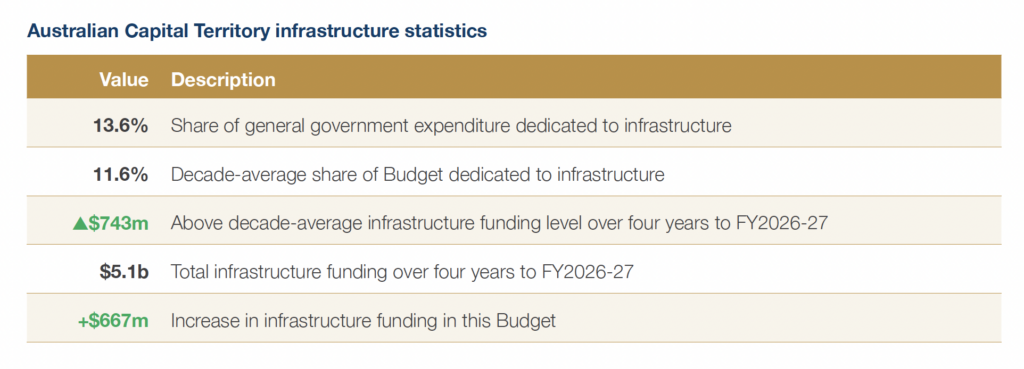
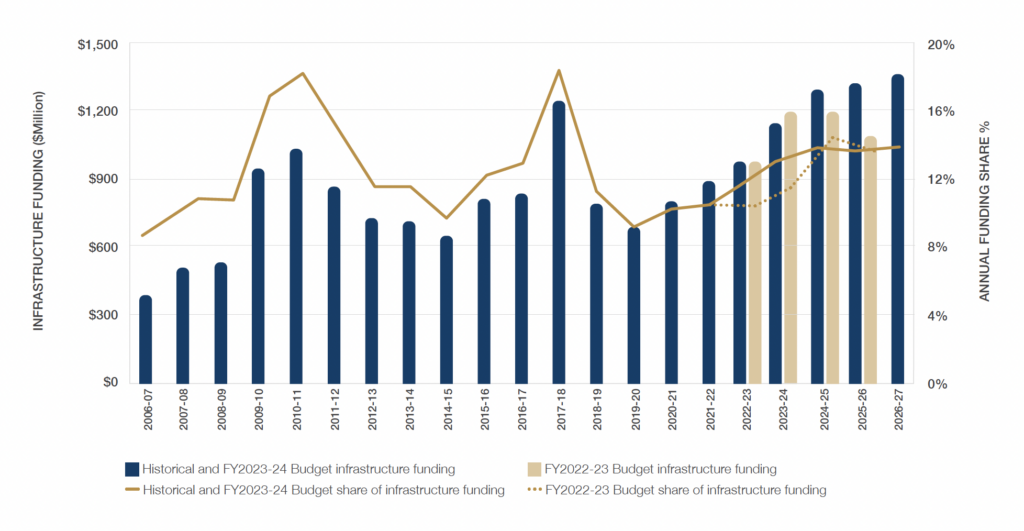
The 2023-24 ACT Budget includes an infrastructure investment of $5.1 billion in general government expenditure over the four years to FY2026-27. This capital commitment to infrastructure is $163 million more than the 2022-23 Budget, representing an increase of 15 per cent. The share of total government expenditure on infrastructure is now 13.6 per cent, up from 12.8 per cent last year and above the ten-year average of 11.6 per cent.
This year’s Budget continues to follow a five-year budgeting and reporting cycle for its capital works program, including for general government sector infrastructure spending. The five-year total commitment for infrastructure is $6.4 billion. To maintain comparability of commitments – both as a share of total spending, and across state, territory and Federal levels – the Budget Monitor will continue to focus on a four-year reporting cycle, accounting for the current Budget year and three forward estimate years.
Several new projects committed to in Budget, going against national grain
The Budget commits $994 million over the next four years for new capital works in this year’s Budget, equivalent to 20 per cent of the total four-year spend. The remaining funding is split across $295 million to improve existing infrastructure, $2.6 billion to continue capital works currently under delivery, and $1.7 billion in provisions for projects yet to receive final approvals.
New and ongoing allocations demonstrative of diverse pipeline, including second major hospital project
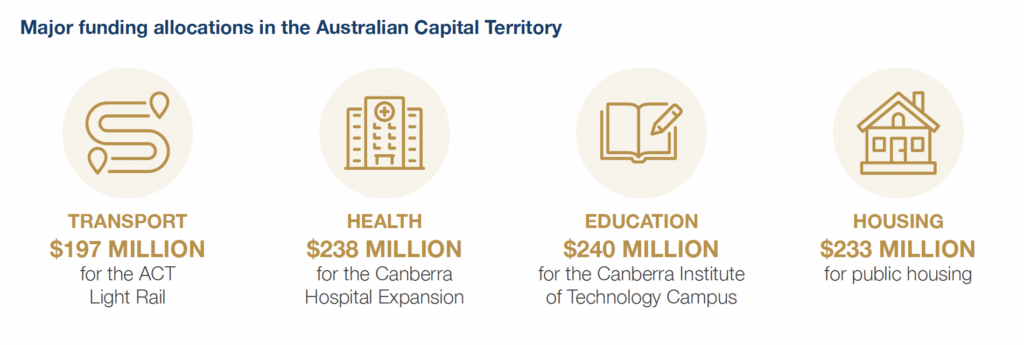
In transport, $121 million has been allocated over the next three years to new light rail vehicles and depot expansion, as well as $76 million over the next two years for the ACT Light Rail Stages 2A and 2B. A further $60 million has been committed over the next two years to Raising London Circuit, with $51 million allocated to FY2023-24.
In health, $238 million has been committed over the next two years for the completion of the Canberra Hospital Expansion. Additionally, $64 million has been dedicated over two years for the design works for a New Northside Hospital at the site of the existing Calvary Hospital in Bruce. The project has a total estimated cost of $1 billion, with construction expected to commence in FY2025-26 and be complete by FY2030-31.

6th Place: Queensland
Queensland Budget makes second successive major infrastructure spend increase, shifts up to sixth position
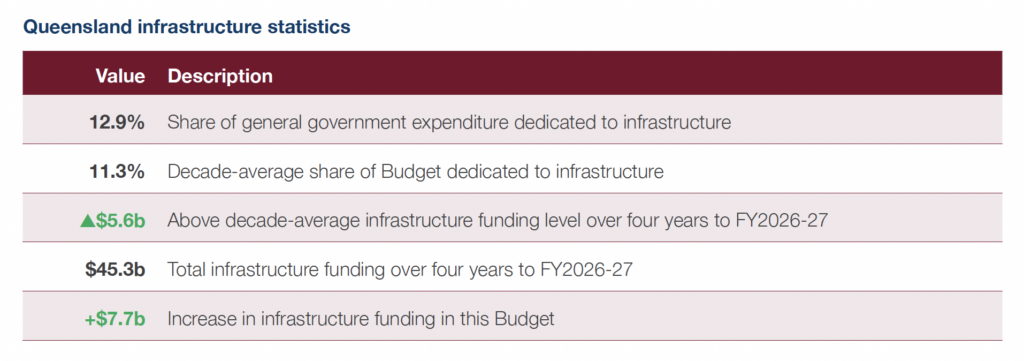
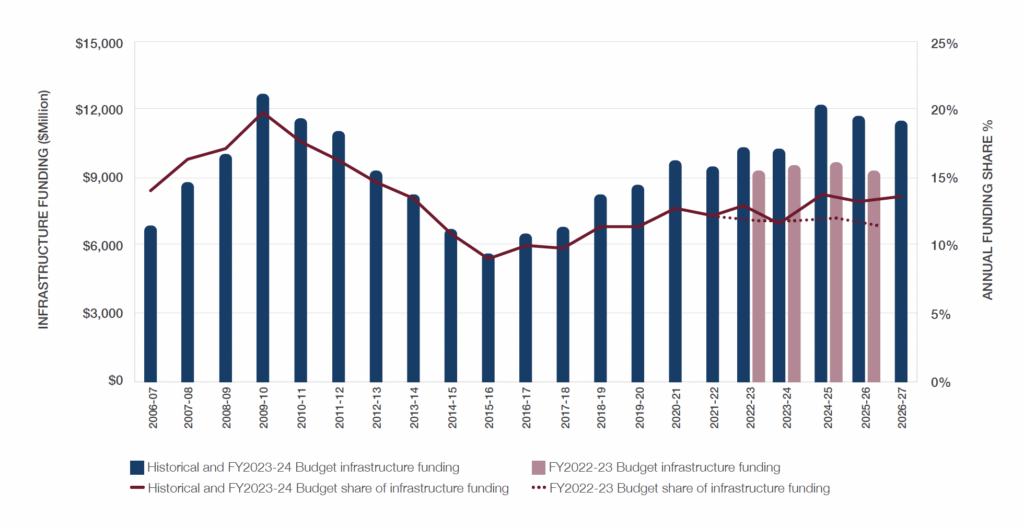
The 2023-24 Queensland Budget allocates $45.3 billion in general government expenditure to infrastructure over the next four years – a $7.7 billion, or 21 per cent, increase from last year’s Budget. This infrastructure funding represents 12.9 per cent of the Queensland Government’s total general government expenditure, above the State’s 10-year average of 11.6 per cent. Following last year’s 19 per cent increase in infrastructure expenditure, the State has been able to move itself beyond seventh position for the first time since the Budget Monitor commenced publication.
2032 Olympic and Paralympic Games receive long-awaited Budget commitments, uncertainty remains
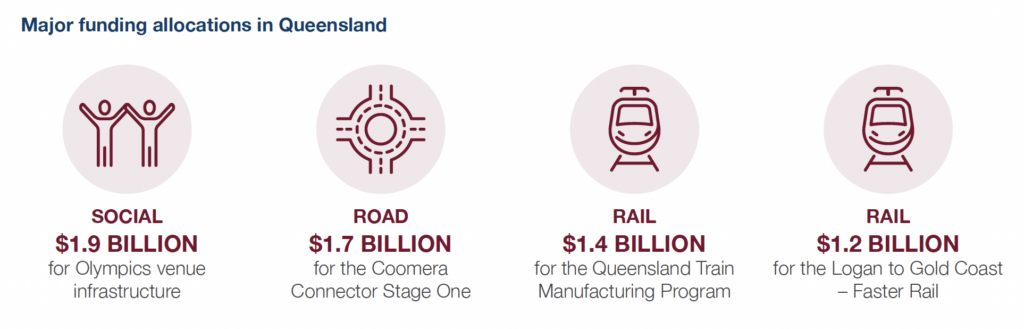
After the concern surrounding the limited commitments in last year’s Budget, this year sees $7.1 billion allocated over 10 years to infrastructure for the 2032 Brisbane Olympic and Paralympic Games. This is jointly funded by the Federal and Queensland Governments. Despite the large and long-term figure, only $1.9 billion has been allocated over the next four years, including $68 million in FY2023-24. This funding has been allocated to the delivery of new and upgraded venue infrastructure. No further funding breakdown has been provided.
Capacity Expansion Program receives reduced allocation
The health capital program is $1.6 billion in FY2023- 24, including $415 million for the Queensland Health Capacity Expansion Program (CEP). This is less than half of the $992 million allocated for the program in the 2022-23 Budget for FY2023-24 and includes $52 million for the New Bundaberg Hospital, $74 million for the New Coomera Hospital, and $50 million for the New Toowoomba Hospital. This decline in allocations runs counter to what the market may have expected with many of the CEP’s projects soon expected to commence construction.
Queensland Government makes large-scale pumped hydro commitment
This Budget’s energy commitments are mostly centred on the delivery of the Queensland Energy and Jobs Plan. To assist meeting the Plan’s goals, the Budget includes $6 billion in equity financing to the newly established Queensland Hydro. This investment commitment will be directed to the $14 billion Borumba Pumped Hydro Energy Storage project over its construction phase. It remains unclear how much of this $6 billion has been allocated over the next four years.
7th Place: Tasmania
Tasmania slows its infrastructure spend, falling back down the rankings
The Tasmanian Budget allocated $4.3 billion in general government infrastructure spend over the next four years, including $1.2 billion in FY2023-24. This four-year infrastructure spend is $582 million lower than the previous Tasmanian Budget. The 11.6 per cent of general government expenditure apportioned to infrastructure is 1.9 percentage points lower than last year but remains above the State’s 10-year average of 8.8 per cent.
More than half of the infrastructure spend is on roads and bridges
Headlining the funding allocations in this year’s Budget is a total of $2.2 billion over four years for roads and bridges, including $683 million in FY2023-24. This includes $522 million for the New Bridgewater Bridge project over four years. In addition, $61 million has been allocated over four years to the $565 million Midland Highway project, which is scheduled for completion in 2026. Through Federally-funded programs, the Budget allocates $404 million over the next four years through the Roads of Strategic Importance program, including $93 million in FY2023-24.
Social infrastructure allocations centred on major projects
A handful of large projects receive the bulk of social infrastructure funding in this Budget. The $580 million Launceston General Hospital Redevelopment – Stage Two received $84 million over the next four years. The project is scheduled for completion in 2032. The Royal Hobart Hospital Redevelopment Stages One and Two have been allocated a combined $142 million over the next four years, including $46 million in FY2023-24.
The Budget allocates $230 million over the next four years to the $375 million Macquarie Point Urban Renewal program, including $15 million in FY2023-24. The New Northern Correctional Facility has been allocated $124 million over the next four years including $8 million in FY2023-24.
8th Place: Western Australia
The Government of Western Australia increases infrastructure commitment, but share of overall funding declines
The Government of Western Australia’s 2023-24 Budget allocates $15.6 billion to infrastructure over the next four years, including $3.2 billion in FY2022-23. This represents a $684 million, or five per cent, jump in funding compared to last year’s four-year projection. Despite this increase, the share of general government expenditure allocated to infrastructure falls to 9.6 per cent, leaving WA in last place in Budget Monitor rankings for the seventh consecutive year.
Market capacity constraints contribute to a significant number of cost escalations for road and rail projects
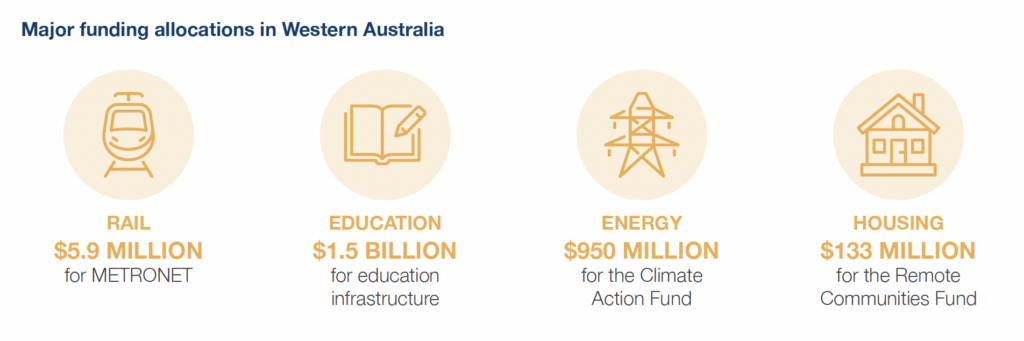
METRONET has been allocated $5.9 billion over the next four years including $3.1 billion in FY2023-24. The Budget outlines a number of cost escalations for METRONET projects including $528 million for the Morley-Ellenbrook Line; $375 million for the Yanchep Rail Extension; $244 million for the Thornlie-Cockburn Link; and $107 million for Baywater Station. These escalations follow last year’s Budget, which saw an additional $380 million allocated to the Thornlie-Cockburn Link and the Yanchep Rail Extension. In both years, the Government has cited supply chain constraints as the cause of these increases.
Supply pressures are also impacting WA road projects with no new major road infrastructure commitments. An additional allocation of $650 million has been made over FY2023-2024 to FY2024-2025, to relieve cost pressures on existing projects, including $100 million for the Bunbury Outer Ring Road. The total funding allocation for metropolitan and regional roads to FY2026-27 is $6.7 billion.
WA Budget allocates spend to energy generation projects
In energy, the Budget allocates $950 million over the next four years to the Climate Action Fund for future climate action and renewable energy initiatives, including $654 million in FY2023-24. This commitment commitment includes $450 million in general government expenditure, for renewable energy initiatives, with $23 million allocated to accelerating environmental approvals for renewable energy proposals.
The remaining $500 million will be provided to the State’s Government-owned energy corporations to partially fund the decarbonisation of the State’s South West Interconnected System. This investment comprises a $2.7 billion upgrade through Synergy to construct the Collie Battery Energy Storage System and the Kwinana Battery Energy Storage System Stage Two. Western Power have been allocated $126 million for transmission upgrades.
Federal Government
Infrastructure allocations uncertain due to announcement of Review
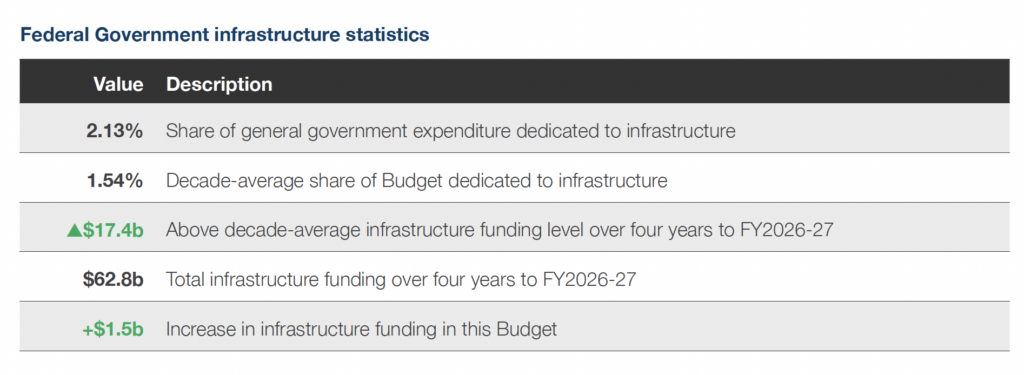
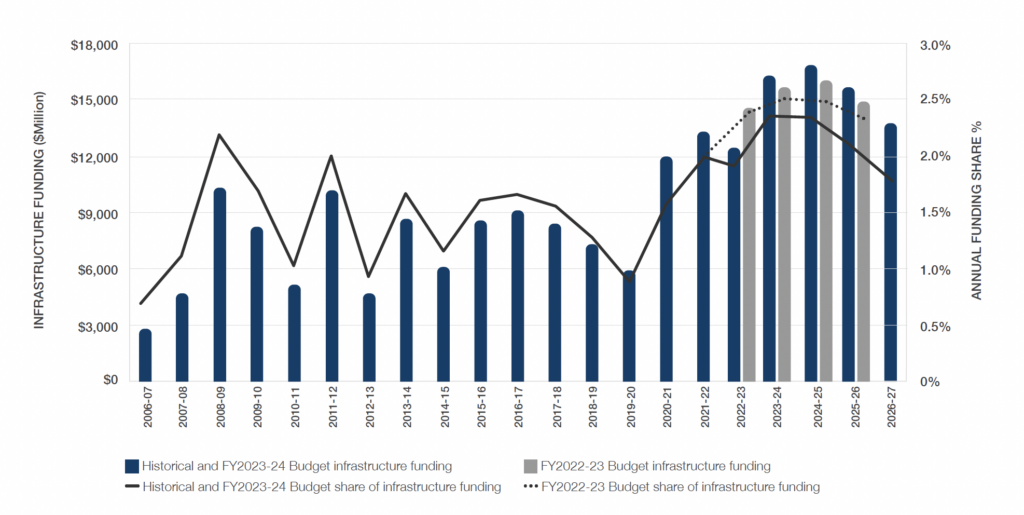
The 2023-24 Federal Budget projects general government infrastructure funding of $62.8 billion over the four years to FY2026-27. This is $1.5 billion – or two per cent – higher than the 2022-23 Budget. This allocation represents 2.13 per cent of total general government spending, with this Budget’s four-year spend being $17.4 billion above the infrastructure expenditure long-term trend of 1.54 per cent of general government expenditure.
No new transport projects announced – but spending increased
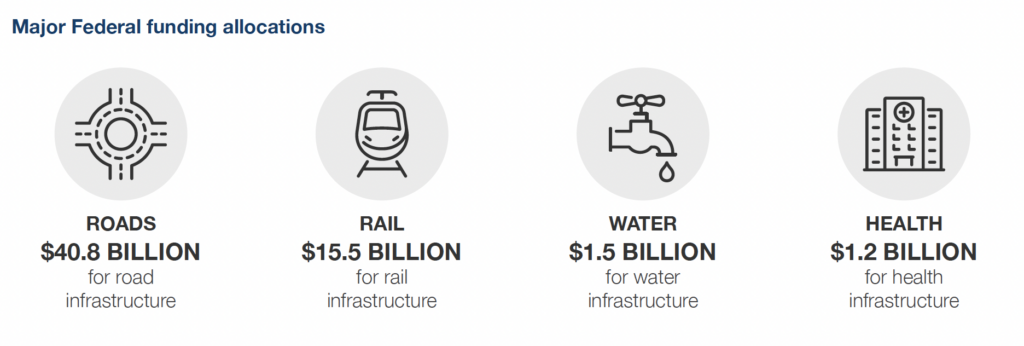
The Budget sees $40.8 billion allocated to roads over four years, including $10.1 billion in FY2023-24. In road and rail, no new projects have been confirmed in the Budget – however, both areas have seen funding increases. This includes an additional $1.1 billion to existing road maintenance and safety programs. $362 million has been allocated to infrastructure projects within NSW including safety upgrades on Bells Line of Road and planning for the Nowra Bypass. In rail, this Budget confirms the establishment of the High Speed Rail Authority.
An additional $200 million over two years will be allocated for planning of land transport projects through the Major Projects Business Case Fund.
Over the next four years, the Budget has allocated $3 billion through the Roads of Strategic Importance Program, $2 billion through the Roads to Recovery Program, $849 million through the Local Roads and Community Infrastructure Program, and $415 million through the Northern Australia Roads Program.
Budget confirms commitments to the Brisbane Olympic and Paralympic Games
The Budget commits $3.4 billion to the 2032 Brisbane Olympic and Paralympic over 10 years from FY2023-24. This includes $2.5 billion over 10 years to deliver the Brisbane Arena and $935 million to deliver 16 new or upgraded venues. The 2023-24 Budget allocates $1.1 billion over the next four years to FY2026-27. The remainder of funding is allocated beyond the forward estimates.
Related Content
Budget Hub 2025
Find all you need to know about the latest Budget papers from Federal, State and Territory Governments. We provide insights into their infrastructure investment programs beyond the headline figures.

Australian Infrastructure Budget Monitor 2024-25
Infrastructure Partnerships Australia’s Australian Infrastructure Budget Monitor 2024-25 (Budget Monitor) measures infrastructure funding commitments by jurisdictions for the current Budget year and forward estimates (being FY2024-25 to ...
Budget Hub 2024
Find all you need to know about the latest Budget papers from Federal, State and Territory Governments. We provide insights into their infrastructure investment programs beyond the headline figures.
Budget Hub 2023
Find all you need to know about the latest Budget papers from Federal, State and Territory Governments. We provide insights into their infrastructure investment programs beyond the headline figures.
Australian Infrastructure Budget Monitor 2022-23
The 2022-23 Budgets delivered by Australia's Federal, State and Territory Governments increase infrastructure expenditure once again.
Budget Hub 2022
Find all you need to know aboout the latest Budget papers from Federal, State and Territory Governments. We provide insights into their infrastructure investment programs beyond the headline figures.
Australian Infrastructure Budget Monitor 2021-22
The 2021-22 Budgets delivered by Australia's Federal, State and Territory Governments have set yet another high watermark.
Budget Hub 2021
Infrastructure Partnerships Australia's analysis of infrastructure funding commitments by jurisdictions for the current Budget year and forward estimates. This analysis collates information from the latest Budget papers from Federal, ...
Australian Infrastructure Budget Monitor 2020-21
The 2020-21 Budgets delivered by Australia's Federal, State and Territory Governments have been perhaps the most important in living memory.
Contact Information
Adrian Dwyer
Chief Executive Officer
Mollie Matich
Head of Policy and Research
Boronia Morison
Head of External Affairs
Sign up for more Infrastructure Analysis
Sign up for our popular weekly Infrastructure Report newsletter and keep up to date on all the latest developments in the sector.
Sign Up