
Australian Infrastructure Budget Monitor 2022-23
The 2022-23 Budgets delivered by Australia's Federal, State and Territory Governments increase infrastructure expenditure once again.
This report collates information from the latest Budget papers from Federal, state and territory governments to provide insights into their infrastructure investment programs beyond the headline figures.
Infrastructure Partnerships Australia’s Australian Infrastructure Budget Monitor (Budget Monitor) measures infrastructure funding commitments by jurisdictions for the current Budget year and forward estimates (being FY2022-23 to FY2025-26).
This report collates information from the latest Budget papers from Federal, state and territory governments to provide insights into their infrastructure investment programs beyond the headline figures. The purpose of the Budget Monitor is to inform the community, industry and researchers about historical and projected public infrastructure investment in Australia.
The strength of each jurisdiction’s infrastructure program is assessed according to the aggregate general government sector infrastructure funding commitment over the period FY2022-23 to FY2025-26 as a share of total general government sector expenditure. This methodology allows for comparison of small and large jurisdictions and provides insights into the relative importance of infrastructure as a government priority over time.
Video Snapshot
League Table
Figure 1: 2022-23 Australian Infrastructure Funding Levels, ranked by share of Budget Expenditure
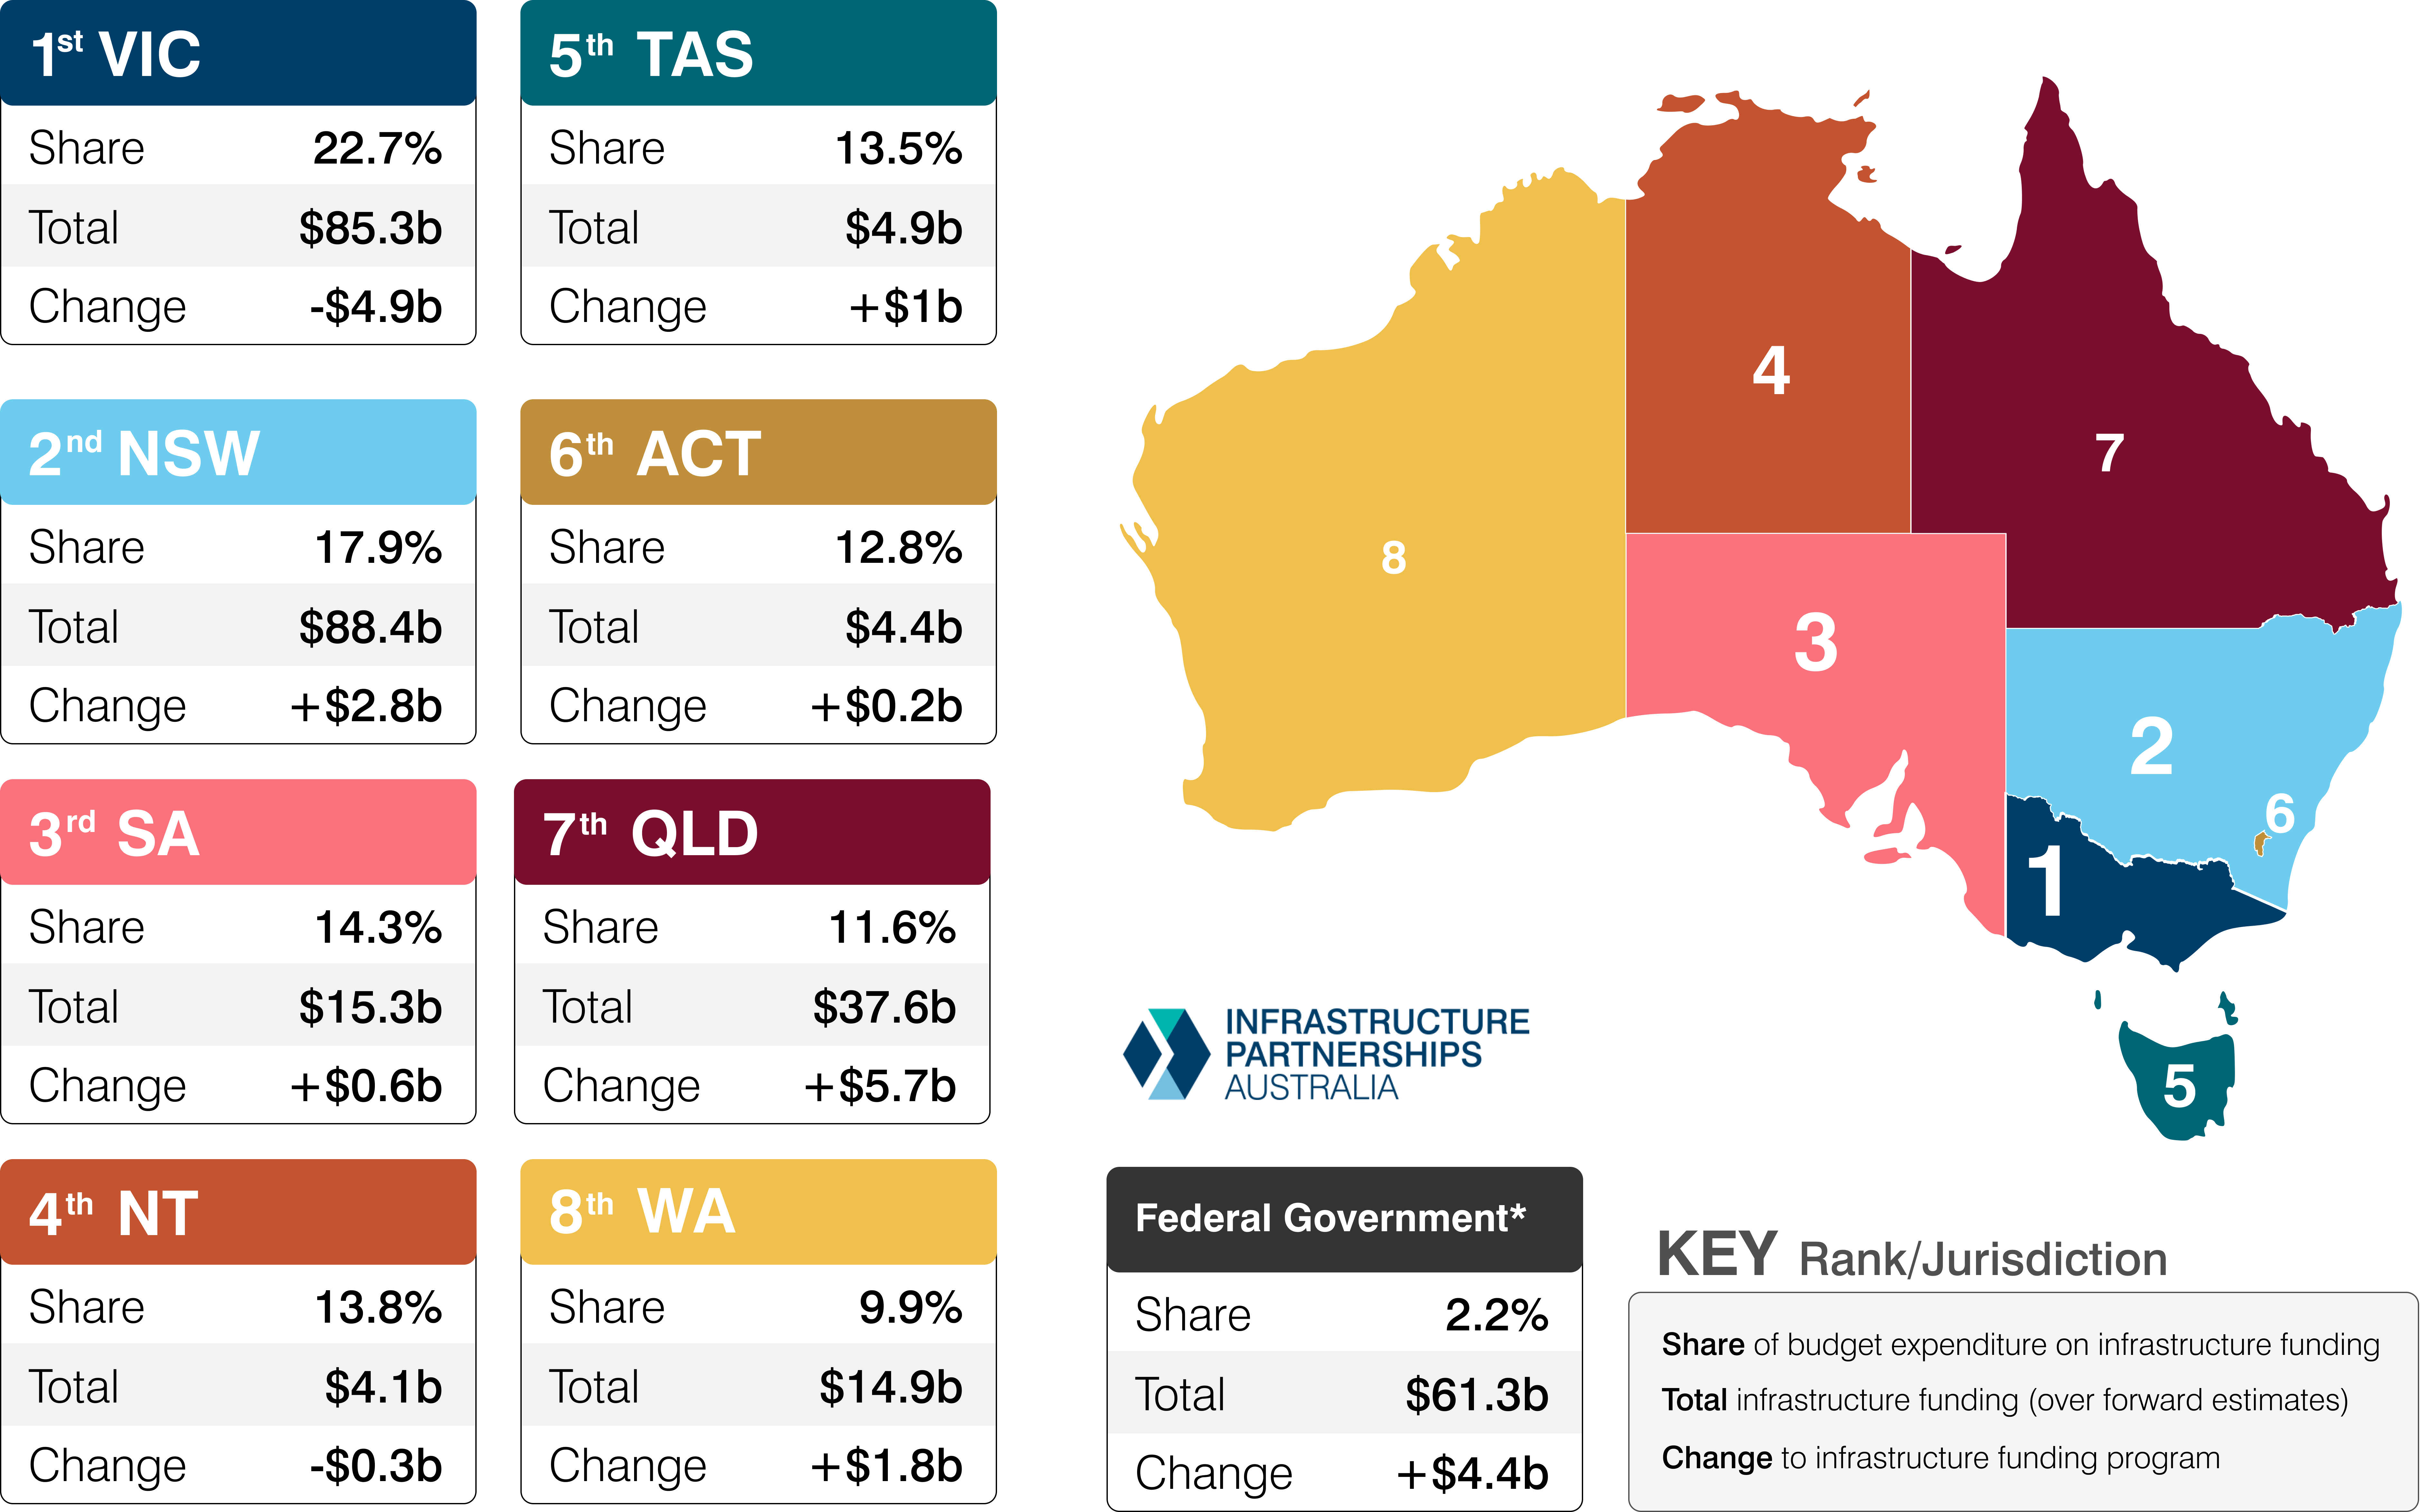
*The Federal Government primarily funds state infrastructure projects. As such it is not formally included in the rankings. We include it in the report to provide a comprehensive view of funding commitments.
Key Insights




Overview
Infrastructure wave continues to build with yet another high watermark set in the 2022-23 Budgets
By allocating $254.8 billion of general government expenditure over the four years to FY2025-26, this year’s Budgets have eclipsed last year’s infrastructure spend of $248 billion – by 2.7 per cent.
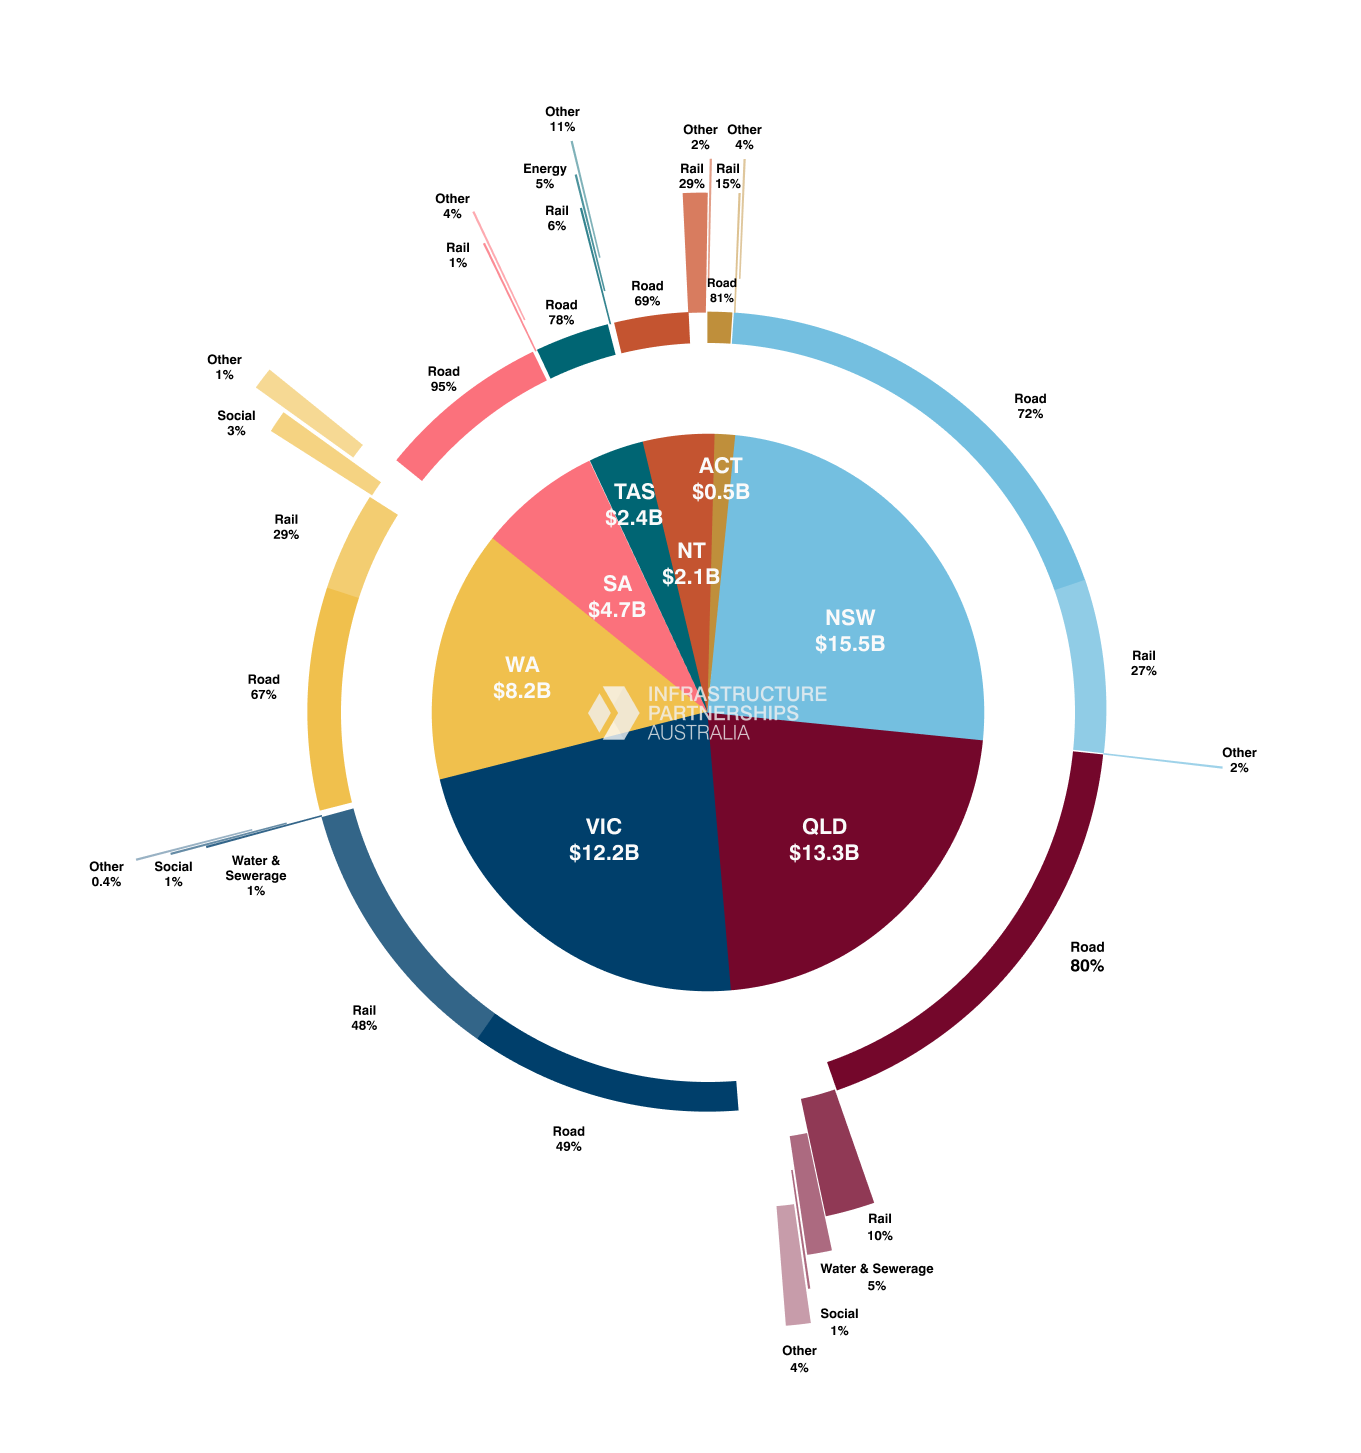
While not included in the rankings, the Federal Government has again raised its infrastructure funding substantially – allocating over $61 billion in general government expenditure to infrastructure projects across the country.
Federal Government allocations to infrastructure have now increased 91 per cent since the 2019-2020 Budget.
The inside ring of Figure 2 shows each state and territory’s allocation of Federal funding, while the outer ring breaks down each jurisdiction’s funding by infrastructure asset class.
Figure 2: Federal Budget infrastructure allocations by jurisdiction and asset class
Source: Infrastructure Partnerships Australia analysis based on 2022-23 Federal Budget
Jurisdiction rankings
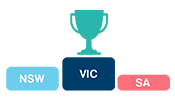
After taking top spot last year for the first-time, Victoria has once again finished in first place in the Budget Monitor rankings with an $85.3 billion allocation to infrastructure – representing a 22.7 per cent of the State’s total general government expenditure. Victoria defends its position in top spot despite moderating its four-year allocation by $4.9 billion in response to a heated infrastructure market.
New South Wales takes second place allocating $88.4 billion in general government expenditure to infrastructure over four years. This represents a $2.8 billion or three per cent increase on the State’s 2021- 22 four-year allocation, however due to a 10 per cent increase in total general government expenditure, the State’s share of general government expenditure has declined from 19 per cent to 17.9 per cent.
South Australia and the Northern Territory have swapped places in this year’s rankings, with South Australia moving up to third place after increasing its four-year share of total spending on infrastructure to 14.3 per cent, while the Northern Territory takes fourth place by decreasing its share from 15 per cent to 13.8 per cent.
Similarly, Tasmania and the Australian Capital Territory have traded places, with Tasmania taking fifth place in its 13.5 per cent allocation to infrastructure. The Australian Capital Territory finishes in sixth place at 12.8 per cent, down from 13.1 per cent last year. Queensland remains in seventh place with 11.6 per cent allocated for infrastructure over four years.
Queensland’s rank comes despite a $5.8 billion, 19 per cent increase in infrastructure spending. The Western Australian Budget delivered an infrastructure funding share of 9.9 per cent of general government expenditure – above the 10-year average of 9.5 per cent. However, the State remains in last place in the rankings for the sixth consecutive year.
Per Capita Infra Spend Analysis
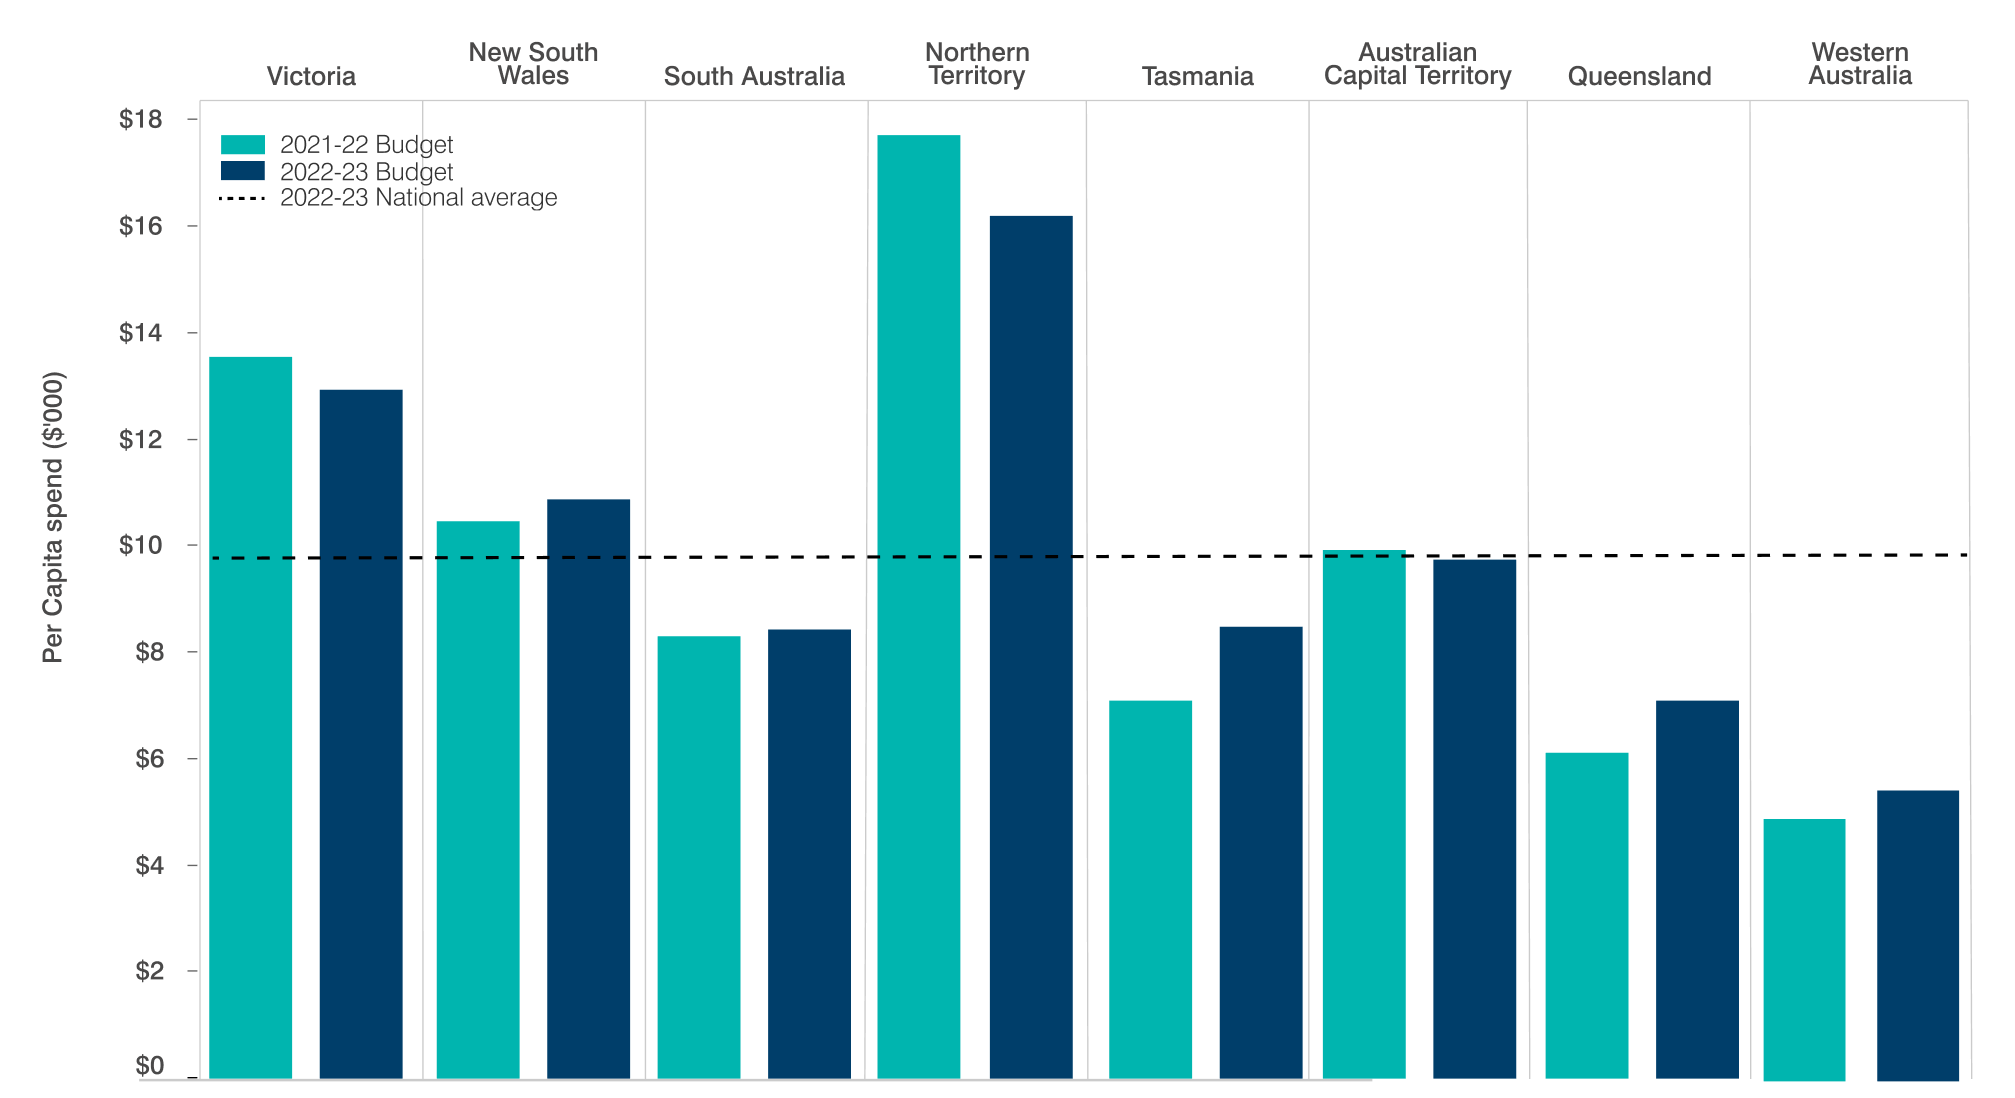
This year’s Budget season sees mixed results for per capita infrastructure spend, with most states delivering minor increases. A $1,400 per person increase in Tasmania and a $1,500 per person decrease in the Northern Territory provide exceptions to this rule. Despite this decrease, the smaller population and large geography of the Northern Territory sees it deliver the highest per capita infrastructure spend again. The moderation of infrastructure spending sees a $600 decline per person in Victoria, however this remains significantly higher than the historical average after the $3,000 increase delivered in the 2021-22 Budget. Figure 3 shows per capita infrastructure investment across Australia over the last two years.
Figure 3: Per capita infrastructure funding by state and territory
Source: Infrastructure Partnerships Australia analysis based on 2022-23 Federal Budget

Related Content
Australian Infrastructure Budget Monitor 2026-27
Infrastructure Partnerships Australia’s Australian Infrastructure Budget Monitor 2026-27 measures infrastructure funding commitments by jurisdictions for the current Budget year and forward estimates (FY2026-27 to FY2029-30).

Budget Hub 2026
Find all you need to know about the latest Budget papers from Federal, State and Territory Governments. We provide insights into their infrastructure investment programs beyond the headline figures.
Australian Infrastructure Budget Monitor 2025-26
Infrastructure Partnerships Australia’s Australian Infrastructure Budget Monitor 2025-26 (Budget Monitor) measures infrastructure funding commitments by jurisdictions for the current Budget year and forward estimates (FY2025-26 to FY2028-...
Budget Hub 2025
Find all you need to know about the latest Budget papers from Federal, State and Territory Governments. We provide insights into their infrastructure investment programs beyond the headline figures.
Australian Infrastructure Budget Monitor 2024-25
Infrastructure Partnerships Australia’s Australian Infrastructure Budget Monitor 2024-25 (Budget Monitor) measures infrastructure funding commitments by jurisdictions for the current Budget year and forward estimates (being FY2024-25 to ...
Budget Hub 2024
Find all you need to know about the latest Budget papers from Federal, State and Territory Governments. We provide insights into their infrastructure investment programs beyond the headline figures.
Australian Infrastructure Budget Monitor 2023-24
Infrastructure Partnerships Australia’s Australian Infrastructure Budget Monitor 2023-24 (Budget Monitor) measures infrastructure funding commitments by jurisdictions for the current Budget year and forward estimates (being FY2023-24 to ...
Budget Hub 2023
Find all you need to know about the latest Budget papers from Federal, State and Territory Governments. We provide insights into their infrastructure investment programs beyond the headline figures.
Budget Hub 2022
Find all you need to know aboout the latest Budget papers from Federal, State and Territory Governments. We provide insights into their infrastructure investment programs beyond the headline figures.
Contact Information
Adrian Dwyer
Chief Executive Officer
Boronia Morison
Head of External Affairs
Jack Bateman
Head of Data and Analytics
Sign up for more Infrastructure Analysis
Sign up for our popular weekly Infrastructure Report newsletter and keep up to date on all the latest developments in the sector.
Sign Up