
Australian Infrastructure Budget Monitor 2018-19
The 2018-19 Australian Infrastructure Budget Monitor reaffirms the two-economy divide in infrastructure across Australia. NSW and Victoria, ranked first and second, have large infrastructure funding commitments facilitated by strong fiscal positions. Asset recycling continues to support growth, with both states benefiting from selling their shares in Snowy Hydro to the Commonwealth, among other asset divestments.
Infrastructure Partnerships Australia’s Australian Infrastructure Budget Monitor measures jurisdictions based on infrastructure funding commitments over the current budget year and forward estimates (FY2018-19 to FY2020-21). This report collates information from the latest Budget papers from Commonwealth, state and territory governments to compare their infrastructure investment programs.
The purpose of the Australian Infrastructure Budget Monitor is to inform the community, industry and researchers about historical and projected public infrastructure investment activity in Australia. It allows readers to compare and evaluate the commitment by governments to building infrastructure, which provides both a near term stimulation impact on the economy and the foundation for future economic and social development.
Analysis
Figure 1: 2018-19 Australian infrastructure funding levels, ranked by share of budget expenditure
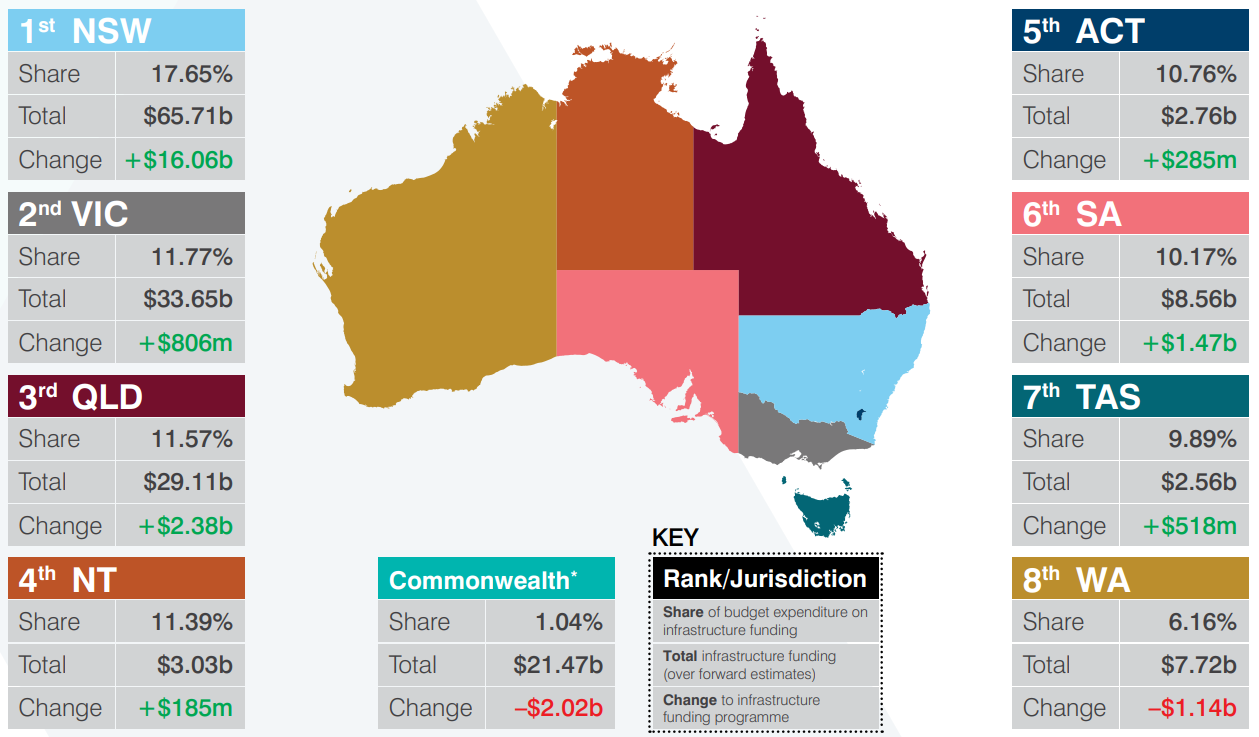
*The Commonwealth Government primarily funds state infrastructure projects. As such it is not formally included in the rankings. We include it in the report to provide a comprehensive view of funding commitments.
Source: Infrastructure Partnerships Australia calculations, based on 2018-19 and 2017-18 Budgets.
The 2018-19 Australian Infrastructure Budget Monitor reaffirms the two-economy divide in infrastructure across Australia. NSW and Victoria, ranked first and second, have large infrastructure funding commitments facilitated by strong fiscal positions. Asset recycling continues to support growth, with both states benefiting from selling their shares in Snowy Hydro to the Commonwealth, among other asset divestments.
In line with NSW and Victoria, Queensland has also significantly increased its infrastructure funding levels this Budget by $2.38 billion. However, it might prove difficult for Queensland to maintain infrastructure funding at current levels in the future due to burgeoning state debt. Western Australia is experiencing similar fiscal pressure and has reduced infrastructure funding levels by $1.14 billion, with net debt projected to climb over the forward estimates. However, in contrast to Queensland, Western Australia is exploring some asset sales.
Apart from Western Australia and the Commonwealth, all other governments have increased their infrastructure funding levels this year. The Commonwealth has decreased hard dollar infrastructure funding levels to the states by $2.02 billion this Budget. However, beyond the forward estimates, the Commonwealth intends to grow infrastructure funding levels out to FY2027-28 as outlined by an overview of the Commonwealth’s 10-year infrastructure investment program released by the Department of Infrastructure, Regional Development and Cities.
Insights
• Together NSW and Victoria account for 65 per cent of total infrastructure funding;
• General government infrastructure funding sums to over $153.1 billion across the states over the four years; and
• The national average of infrastructure funding is $6,181 per capita over the four years.
Figure 2 shows the breakdown of infrastructure funding by jurisdiction, with NSW and Victoria making up 65 per cent of infrastructure funding nationally. The Commonwealth is not included as its infrastructure funding contributes directly to state infrastructure funding. Of total funding deployed by the states, the Commonwealth Government contributes about 14 per cent, although the distribution of this funding varies across the states and territories.
Figure 2: Who’s funding what? National infrastructure funding, share of total, by jurisdiction (FY2018-19 to FY2021-22)
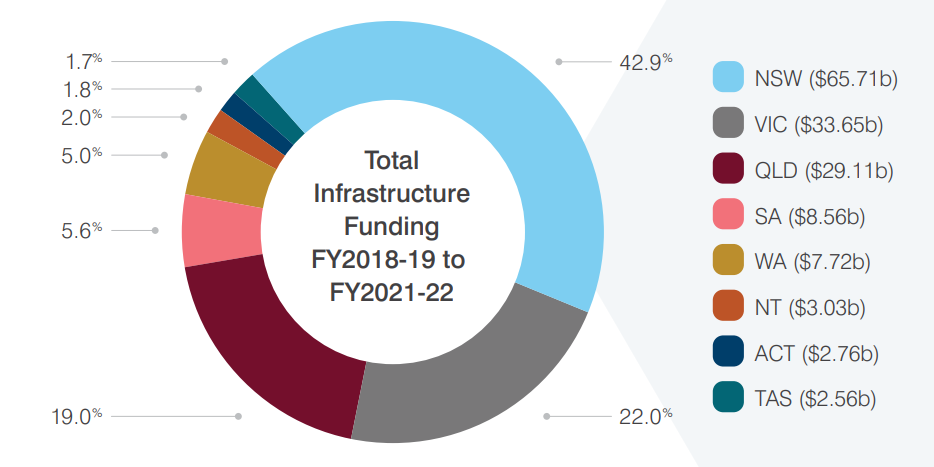
Source: Infrastructure Partnerships Australia analysis
Figure 3 shows the infrastructure funding per capita for each state and the national average. Infrastructure funding per capita reflects the investment priorities of governments as well as the varied infrastructure needs of different populations. Jurisdictions vary widely in the geographic and demographic distribution of their populations and factors such as urbanisation and concentration of population are key influencers of infrastructure funding per capita.
By analysing infrastructure funding per capita, we can see that although Northern Territory ranks fourth on general government total expenditure (GGE) allocated to infrastructure, it has the highest funding per capita, at $12,264 per person. NSW and ACT are the only other jurisdictions above the national average, allocating $8,301 and $6,632 per capita respectively. The national average is $6,181 per capita over the four years.
Figure 3: State infrastructure funding per capita FY2018-19 to FY2021-22
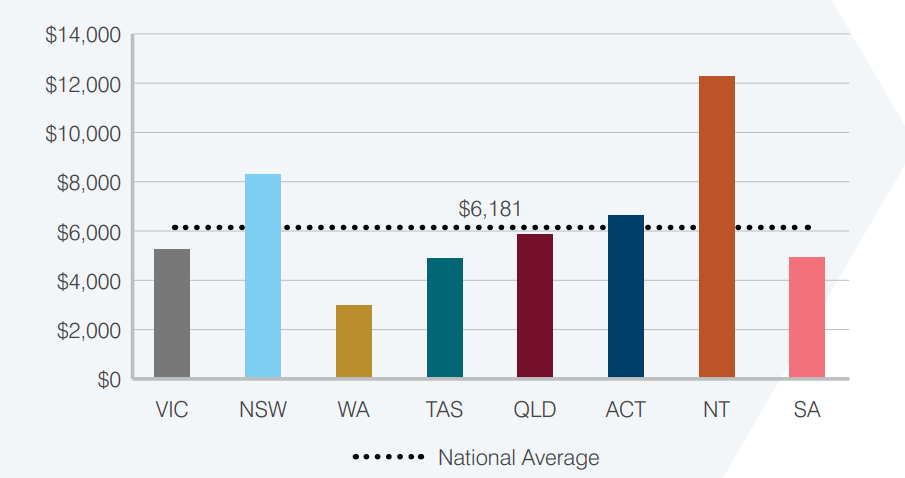
Source: Infrastructure Partnerships Australia analysis

Related Content
Budget Hub 2024
Find all you need to know about the latest Budget papers from Federal, State and Territory Governments. We provide insights into their infrastructure investment programs beyond the headline figures.

Australian Infrastructure Budget Monitor 2023-24
Infrastructure Partnerships Australia’s Australian Infrastructure Budget Monitor 2023-24 (Budget Monitor) measures infrastructure funding commitments by jurisdictions for the current Budget year and forward estimates (being FY2023-24 to ...
Budget Hub 2023
Find all you need to know about the latest Budget papers from Federal, State and Territory Governments. We provide insights into their infrastructure investment programs beyond the headline figures.
Australian Infrastructure Budget Monitor 2022-23
The 2022-23 Budgets delivered by Australia's Federal, State and Territory Governments increase infrastructure expenditure once again.
Budget Hub 2022
Find all you need to know aboout the latest Budget papers from Federal, State and Territory Governments. We provide insights into their infrastructure investment programs beyond the headline figures.
Australian Infrastructure Budget Monitor 2021-22
The 2021-22 Budgets delivered by Australia's Federal, State and Territory Governments have set yet another high watermark.
Budget Hub 2021
Infrastructure Partnerships Australia's analysis of infrastructure funding commitments by jurisdictions for the current Budget year and forward estimates. This analysis collates information from the latest Budget papers from Federal, ...
Australian Infrastructure Budget Monitor 2020-21
The 2020-21 Budgets delivered by Australia's Federal, State and Territory Governments have been perhaps the most important in living memory.
Australian Infrastructure Budget Monitor 2019-20
This report collates information from the latest budget papers from federal, state and territory governments to provide insights into their infrastructure investment programs beyond the headline figures.
Sign up for more Infrastructure Analysis
Sign up for our popular weekly Infrastructure Report newsletter and keep up to date on all the latest developments in the sector.
Sign Up