Pipeline Forecast by Labour Demand
Latest update: 02/12/2021
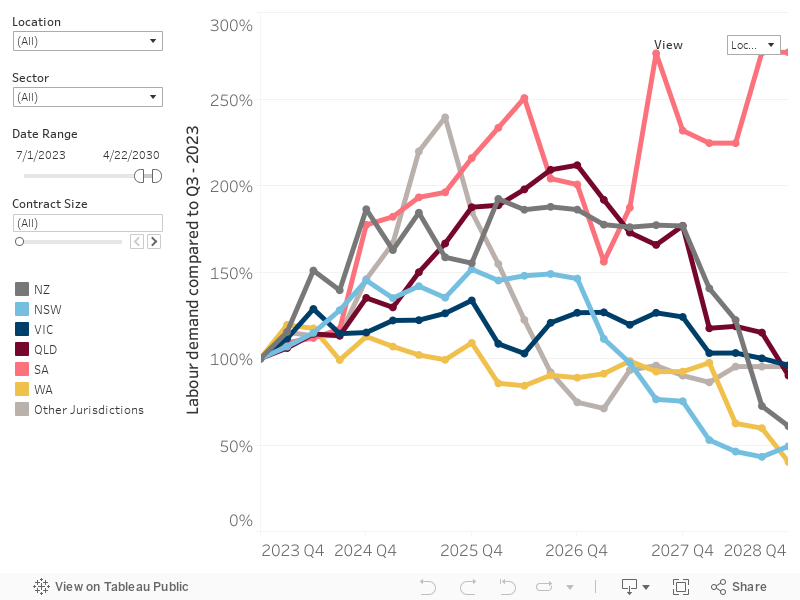
This interactive chart provides a forecast of the labour demand required by the upcoming major infrastructure pipeline in Australia. Data for the forecast is drawn from the projects and contracts on the ANZIP website. This data has then been applied to a model which estimates each project’s quarterly labour requirement across all relevant occupations using ABS employment data and labour intensity benchmarks based on the project’s sector and position in the planning and delivery cycle.
The modelling approach was developed by Deloitte for Infrastructure Partnerships Australia. Read it here.
How to use the graph
View: Use the ‘View’ filter to toggle between viewing the chart by state or by sector.
Select forecast range: Use the ‘Select forecast range’ filter to set the timeframe for the forecast. In this visualisation, the expenditure chart default filter is set to show the five years from Q3 2021. The labour demand chart default filter is set to Q1 2022. The maximum range for the charts is to Q3 of 2031.
Select location: Use the ‘Select location’ filter to select the locations that you are interested in.
Select sector: Use the ‘Select sector’ filter to select the sectors that you are interested in.
Select contract size: Use the ‘Select contract size’ slider to select the total capital value range of construction contracts that you are interested in.
Reset: Click on the |← button in the bottom toolbar to return to the default view.