
2023 International Airfreight Indicator
The 2023 International Airfreight Indicator follows our 2019 and 2021 editions, with the prior edition analysing the changing supply chain, particularly concerning international air routes, as a result of the pandemic. The third edition of the paper finds 2022 airfreight flows reflect a supply chain in recovery and a remarkable resilience of trade – but it is clear that Australia was still grappling with the impacts of trade hurdles with our major partners.
About the 2023 International Airfreight Indicator Report
Despite the importance of moving people and goods to the economy, Australia does not measure and report on the airfreight systematically or consistently.
Infrastructure Partnerships Australia’s International Airfreight Indicator aims to fill the gap by providing a reliable source of information and analysis on the air cargo movements into and out of Australia.
The motivation behind the International Airfreight Indicator is three-fold:
- first, given the increasing role of air transport in facilitating economic activity, an index of its output with 12-month forecasts, in both value and volume terms, can be a reliable indicator of the current and future economic activity of Australia
- second, by providing an overview of the evolving nature of airfreight in Australia, the Airfreight Indicator provides visibility and understanding of the market to industry and government. This includes a more detailed picture of what is moving where and why, how its changing over time, and the different dynamics across airports and wider catchments, and
- third, airfreight measurement through airports can lift the visibility and understanding of its significance to the Australian economy. In turn, this can assist infrastructure planning and development of strategies as well as management across the transport network.
The third edition continues the evolution of airfreight reporting through analysing the pre- to post-COVID threats and opportunities.
Overview
Airfreight continues to make a significant contribution to Australia’s economy
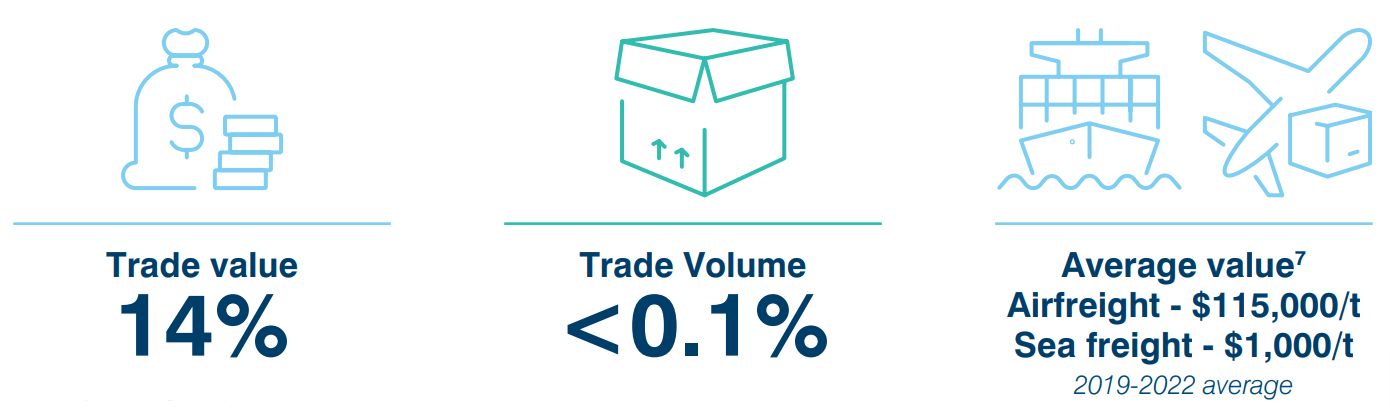
In 2022, the value of international goods transported by airfreight reached $139 billion, equivalent to 14 per cent of Australia’s trade. While the total volume of goods transported by air is low relative to total trade, the high-value nature of airfreighted goods means its contribution to Australia’s economy remains significant.
Airfreight accounted for 20 per cent of total Australian trade value prior to the pandemic. The declining share is largely due to the significant growth in the value of commodity exports and imports by sea since 2019, such as iron ore.
Australia’s airfreight supply chain are still feeling the impacts of the pandemic disruption
The airfreight supply chain carried almost 790,000 tonnes of freight in 2022, equivalent to over 16 fully loaded 747-8 freighter services each day.
The airfreight task, while still significant, remains well below pre-pandemic levels with overall volumes being almost 215,000 tonnes, or 21 per cent, lower than 2019 volumes – though this is a tale of two markets, with imports recovered and the slow recovery of exports contributing to most of these numbers. Volumes carried in 2022 were similar to 2020 and 2021 levels, despite the return of passenger networks and the corresponding return of belly capacity on some key trade routes. The delayed recovery in overall airfreight volumes can be explained by:
- China remaining closed to passenger travel throughout 2022 and emerging trade policy challenges. China was Australia’s top ranked destination for airfreight exports prior to the pandemic.
- Supply chains needing time to adjust to the return of passenger networks and belly capacity.
- A commensurate reduction in ‘preighter’ capacity i.e. the return of passenger services simply replaced preighter capacity which supported a proportion of freight flows in 2020 and 2021.
Source: Infrastructure Partnerships Australia analysis of ABS Custom data
Imports proved more resilient to pandemic disruption with green shoots emerging across key supply chains
Imports proved to be more resilient with volumes totalling 401,041 tonnes in 2022, only 28,000 tonnes or 7 per cent lower compared to pre-pandemic levels (2019). The resilience of airfreight imports is partly due to the growing deployment of dedicated freighters and a lower reliance on belly capacity provided by passenger services.
After an initial drop in 2020, total import volumes have also increased across Melbourne, Brisbane and Perth Airports. For Sydney Airport airfreight imports have increased from 2019 volumes. Australia’s other major airports are also on track to recover to pre-pandemic volumes by 2024.
Airfreight imports continue to consist predominantly of machinery and mechanical appliances, electronics, chemical products, medical/optical/visual instruments, pharmaceutical products and clothing and accessories.
The key markets for airfreight imports continue to be China, USA, New Zealand, Singapore, Hong Kong, and Germany.
Airfreight volumes remain concentrated at Sydney Airport
2022 saw further concentration of airfreight volumes at Sydney Airport, which handled 53 per cent of exports and 55 per cent of imports. Sydney Airport’s share of imports remained consistent with its pre-pandemic share which sat at 49 per cent – however, the Airport’s share of exports was noticeably higher compared to pre-pandemic levels of 37 per cent.
While the ongoing rebuild of passenger networks is likely to see a rebalancing of volumes across all major airports, it is too early to tell what the steady-state freight volumes will be for major airports across Australia post-recovery.
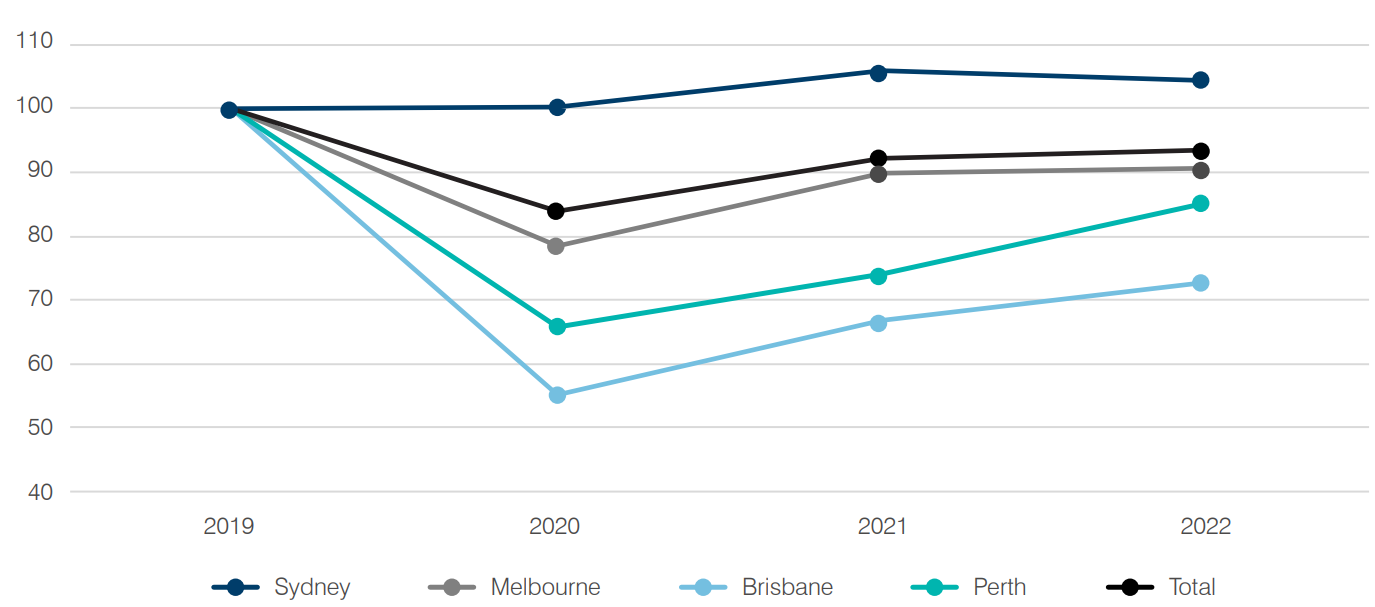
Source: Infrastructure Partnerships Australia analysis of ABS Custom data
Contact Information
Mollie Matich
Head of Policy and Research
IPA Editor
Infrastructure Partnerships Australia
Boronia Morison
Head of External Affairs
Sign up for more Infrastructure Analysis
Sign up for our popular weekly Infrastructure Report newsletter and keep up to date on all the latest developments in the sector.
Sign Up